RESEARCH ARTICLE
- David-Chukwu N. P 1
- Onwuka, G. I. 2
- Onuabuchi, I. C. 1
- Amadi, A. G. 1
- Chukwu, M. N. 3
- Odom, T. C. 3
- Onumadu, K. S. 3
1Department of Hospitality Management and Tourism, Abia State Polytechnic, Aba, Nigeria
2Department of Food Science and Technology, Michael Okpara University of Agriculture, Umudike, Nigeria.
3Department of Food Technology, Abia State Polytechnic, Aba, Nigeria.
4Department of Chemistry/Biochemistry, Abia State Polytechnic, Aba, Nigeria.
*Corresponding Author: David-Chukwu, N. P 1*,
Citation: David-Chukwu, N. P 1*,(2024), Effects of Storage Life and Variety On The Functional Properties Of Stored Achicha. Dietary Nourishment and Food Processing Techniques (DNFPT)1(1), DOI: https://doi.org/10.64347/3064-7061/DNFPT.002
Copyright: © 2024, David-Chukwu, N. P 1*, this is an open-access article distributed under the terms of The Creative Commons Attribution License, which permits unrestricted use, distribution, and reproduction in any medium, provided the original author and source are credited.
Received: January 01, 2024 | Accepted: February 16, 2024 | Published: February 19, 2024
Abstract
The effects of storage life and variety on the functional properties of stored achicha were determined. A-5 kg corms were sorted, washed and boiled for 3 hours and was cooled, peeled and cut into small sizes of average of 2.0 cm by 1.5 cm dimension with a sharp kitchen knife; dried under the sun for 5 days. The dried corms (achicha) were pulverized with a locally fabricated machine and stored in plastic containers for 0, 1, 2, 3-month(s) intervals. The data obtained were analyzed statistically using SPSS version 23. Means were separated at P ≤ 0.05 using Fisher’s Least Significant Differences. After 3 months storage, edeofe, cocoindia and anampu had the following functional properties of achicha: bulk density (0.85, 0.70, 0.60)g/ml, swelling index (0.82, 1.09, 0.92), water absorption capacity (2.08, 2.15, 2.13), oil absorption capacity(0.65, 0.85, 0.86), wettability (16.80, 13.81, 15.72)s, gelation capacity (0.78, 0.70, 0.39)g/5ml, gelation temperature (84, 80, 83)oC, foam stability (5.08, 6.94, 5.00)%, foam capacity (11.29, 12.78, 9.10)%, viscosity (0.11, 0.18, 0.16)mPa and pH (5.59, 6.35, 6.03) respectively. The functional properties showed that they have better potential as soup thickeners. This showed that cocoindia had more stable functional properties than other varieties after 3 months storage
Keywords: Storage, pH, thickener, absorption, capacity, density
Introduction
Achicha (dried cocoyam corms/cormels) is a pre-cooked, sun-dried cocoyam corms/cormels and it lends its name to the vegetarian dish made with it. Achicha does not only have enjoyable taste and satisfying but also low in calories. Achicha can be cooked in combination with fiofio (pigeon pea) or black beans (akidi oji), these are highly nutritional. Green leafy vegetables can also be added to it, for example, green amaranth, ugu and scent leaf. Dry fish is also added which is an optional ingredient (David-Chukwu et al., 2021a, b; 2022).
Cocoyam (Colocassia and Xanthosoma spp.) is a stem tuber that is widely grown in the tropical regions of the world (Eze and Okorji, 2003). About 60% of the World’s cocoyam production (5.7 million ton) is in Africa and majority of the remaining 40% in Asia and the Pacific (Mitra et al., 2007). Eze and Okorji (2003) also reported that Nigeria is the largest producer of cocoyam in the world, accounting for about 40% of the total world output. According to Manner and Taylor (2010), in other parts of the world, species of Colocasia are often referred to as taro, while cocoyam or tannia is used for species of Xanthosoma. In the Pacific Island countries where taro is widely cultivated and consumed, two botanical varieties of Colocasia have been identified as C. esculenta var. esculenta, many times called dasheen, and C. esculanta Var. esculenta, frequently called eddoe. It is referred to as the third important staple root crop after yam and cassava in Nigeria and provides a cheaper yam replacement, especially during periods of food scarcity or insufficient food supply (Onyeka, 2014).
The traditional way to cook taro is roasting on stones or baking in a ground oven. More modern ways of processing taro include steaming, boiling, or baking in the oven (Soudy et al., 2010). It must be thoroughly cooked to prevent mouth and throat itching. The corms and leaves of taro are usually eaten by humans after heat treatments, such as boiling, blanching, steaming, baking, roasting, stewing, and frying and pressure cooking. These methods are effective in improving its digestibility, increasing nutrient bioavailability, minimizing anti-nutritional factors and food-borne diseases. When taro corms are processed into powder and further decrease will occur when processed into taro noodles and cookies (Soudy, et al., 2010). Therefore, the combination of cooking time temperature program is necessary to preserve the nutrients and deactivates the anti-nutritional factors. Cooking substantially may be used in the management of non-communicable illnesses such as obesity, heart disease, blood pressure, diabetes, cancer and gastrointestinal disorders because of the high fibre content (Soudy et al., 2010).
Following the proper drying process, a number of tuber products are harvested and preserved as flour. In the feed and food industries, plays a critical role. According to certain recent studies, making flour from the roots of Colocasia esculenta is a straightforward process. This method involves cooking taro roots in their skin, peeling them, letting them dry in the sun, and then pulverizing them through 500 µm sieves (Njintang and Mbofung, 2003). Taro flour that has been processed can be used to make bread, baby food, cookies, pasta, and other foods. According to Alam and Hasinain (2009), this process disrupts the starch granules in flour, which causes it to become pre-gelatinized and absorb water. This alteration has a significant impact on the flour's functional qualities. Consequently, when mixed with water, it can produce binder properties that instantly produce a homogeneous matrix. Additionally, pre-gelatinized products are said to have a higher overall acceptance rate (Chinnajarn et al., 2006).
C
2.0 Materials and Methods
2.1 Materials
The National Root Crop Research Institute in Umudike, Abia State, provided the fresh cocoyam corms/cormels (ede ofe, NCE 002), cocoindia, NCE 001, and ukpong/anampu, NCE 004). The agronomist from the Cocoyam Unit of the National Research Institute Umudike, Abia State, identified the fresh samples. Figures 1 and 2 depict the cocoyam corms/cormels.
2.2 Methods
2.2.1 Processing of Corms/cormels into Achicha (dried cocoyam)
For every sample, five kilograms of cocoyam corms or cormels were sorted, cleaned, and cooked for three hours. With a sharp kitchen knife, it was cooled, peeled, and cut into small pieces, measuring an average of 2.0 cm by 1.5 cm. For five days, from nine in the morning to six in the evening, they were laid out on a mat and allowed to dry in the sun. A locally built machine was used to grind the dried cocoyam corms/cormels (achicha) before they were placed in different plastic containers for duration of three months. The samples were examined at zero, one, two, and three month intervals. Figures 1, 2, 3, and 4 display images of the cocoyam plant, corms/cormels, and processed achicha, respectively. Additionally, Figure 3 depicts the flow chart for producing achicha from cocoyam corms/cormels (David-Chukwu et al., 2021a, b; 2022).
2.2.2 Determination of Functional Properties of Achicha
The functional properties of the achicha flour samples were measured, and these included bulk density, swelling index, wettability, gelation capacity, gelation temperature, foam stability, foam capacity, viscosity, and pH.
2.2.2.1 Determination of Bulk Density
Using the technique outlined by Chukwu et al. (2018) and Peter-Ikechukwu et al. (2020), the bulk density of the flour samples was calculated. The sample was put into an A-10 ml graduated cylinder. On a lab bench, the bottom of the cylinder was repeatedly tapped gently. Once the 10 ml mark was filled, the procedure was repeated until the sample level did not decrease any further. The weight of the samples divided by the sample volume (g/ml) was used to compute bulk density.
Bulk density (g/ml)

2.2.2.2 Determination of Swelling Index
Using the technique outlined by Mbanali et al. (2018), the swelling index was calculated. It was calculated as the proportion of the swollen volume of extra water. A 1 g sample of flour was mixed with 10 ml of distilled water in a calibrated 10-milliliter measuring cylinder, and the volume was recorded. For one hour, the cylinder was allowed to remain undisturbed. After recording the volume that the sample subsequently occupied, the swelling capacity was computed as follows:
Swelling Index = 
Fig 1: Plant Colocasia esculenta
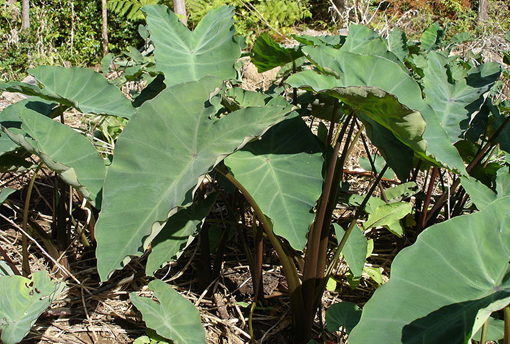
Fig 2: Corms/cormels of Colocasia esculenta

 Cocyam corms/corm
Sorting

washing

Cooking (3hr)
Cooling
Peeling
Cutting
achicha
Fig3: The production flow chart for achicha

Fig: Unprocessed achicha
2.2.2.3 Determination of water and oil absorption capacity
According to Peter-Ikechukwu et al. (2020), the water and oil absorption capacity was determined. Ten milliliters of distilled water or oil were added to a graduated centrifuge tube containing a weighed sample weighing one gram. After that, the sample was well combined and left to stand at room temperature for half an hour. For thirty minutes, the mixture was centrifuged at 4000 rpm. For the purpose of converting the volume of free water or oil (the supernatant) to grams, its density was multiplied. The result was expressed as grams of water or oil absorbed per gram of sample. It was assumed that oil had a density of 0.88 g/ml and water had a density of 1 g/ml
WAC/OAC
Where:
WAC=Water absorption capacity
OAC=Oil absorption capacity
V1=Initial volume of water or oil
V2=Final volume after centrifuging
W= Weight of sample.
D = Density of water/ oil
2.2.2.4 Determination of Wettability
One gram of the sample was weighed into a 25 ml graduated cylinder with a 1 cm diameter, slightly modified from Chukwu et al. (2018). The cylinder was inverted, clamped at a height of 10 cm from the surfaces of a 600 ml breaker containing 500 ml of distilled water, and the open end was covered with aluminum foil paper. The aluminum foil paper was then removed to allow the test material to be damped. The amount of time needed for the sample to get completely wet was its wettability.
2.2.2.5Determination of Gelation capacity
The gelation capacity was calculated using an Onwuka (2018) modified method. In test tubes, 2–20% (w/v) flour suspensions were made using 5 milliliters of distilled water. The suspensions were quickly cooled under cold running tap water after being brought to a boil in a water bath for an hour. The least gelling concentration, also known as the gelation capacity, was defined as the lowest concentration at which the gel formed did not collapse or slips from the invented test tube.
2.2.2.6 Determination of Gelation Temperature
The gelation temperature was calculated utilizing the Onwuka (2018) method. In a test tube, a 10% w/v sample was made. Thirty seconds after gelatinization was visibly observed, the temperature of the aqueous suspension was measured while it was heated in a boiling water bath while being continuously stirred.
2.2.2.7 Determination of Foam stability
Foam stability was assessed by applying the Onwuka (2018) method. In a blender, 2 grams of each sample's measured weight was whipped for 5 minutes at 1600 rpm using 100 milliliters of distilled water. The whipped mixture was poured into a graduated cylinder measuring 150 milliliters. After gently adding 10 milliliters of distilled water to the graduated cylinder, the blender jar was cleaned. The cylinder's foam volume varies every 15, 30, 60, 90, and 120 seconds.
Foam stability = 
2.2.2.8 Determination of Foam Capacity
The Chukwu etal. (2018) method was utilized to ascertain the foam capacity. Each sample was weighed out at 2 g, and it was blended for 5 minutes at 1600 rpm using 100 ml of distilled water in a blender. A 150 ml graduated cylinder was filled with the whipped mixture. After being cleaned with 10 milliliters of distilled water, the blender jar was carefully placed into the graduated cylinder, and after
30 seconds, the volume was recorded. Volumes recorded both before and after whipping were computed as follows:
Foam capacity = 
2.2.2.9 Determination of Viscosity
According to Peter-Ikechukwu et al. (2019), a sample weighing 10 g was dissolved in 100 ml of distilled water and kept at room temperature for two hours while being mechanically stirred. We used a viscometer (model NDJ-9S) to measure the viscosity
2.2.2.10 Determination of pH
Chukwu et al. (2018) and Peter-Ikechukwu et al. (2020) provided the method used to determine the pH. In distilled water, a sample (10% w/v) was prepared. The sample was well combined, and a pH metre (model PHS-3C, China) was used to measure the pH.
2.2.3 Statistical analysis
Version 23 of SPSS software was used to statistically analyze the obtained triplicate data. After determining the mean values, One-Way ANOVA was performed, and Fisher's Least Significant Difference (Landau and Everitt, 2004) was applied to separate the means (P ≤ 0.05).
3.0 Results and Discussion
3.1 Functional Properties of Achicha During Three Months of Storage
The comparison of the mean functional properties of three distinct Colocasia varieties (edeofe, cocoindia, and anampu) of processed achicha over a three-month storage period is presented in Table 1
| FunctinlPropertis | Edeofe (Month) | Cocoindia (Month) | Anampu (Month)
| |||||||||
0
| 1
| 2 | 3 | 0 | 1 | 2 | 3 | 0 | 1 | 2 | 3 | |
| BD | 1.01a ±0.01 | 0.99b ±0.01 | 0.87c ±0.00 | 0.85d ±0.01 | 0.77e ±0.01 | 0.75f ±0.01 | 0.73g ±0.00 | 0.70h ±0.01 | 0.66i ±0.01 | 0.65j ±0.00 | 0.62k ±0.01 | 0.60l ±0.00 |
| SwellingIndex | 2.92a±0.03 | 1.33cde±0.03 | 1.01def±0.00 | 0.82f±0.03 | 2.10b±0.00 | 1.76bc±0.03 | 1.42cd±0.03 | 1.09cdef±0.00 | 2.57a±0.03 | 1.25cde±0.03 | 1.09cdef±0.66 | 0.92ef±0.00 |
| WAC | 2.20d ±0.01 | 2.16e±0.01 | 2.10h±0.01 | 2.08i ±0.01 | 2.30a ±0.01 | 2.22c±0.01 | 2.20d ±0.01 | 2.15f ±0.01 | 2.30a ±0.01 | 2.25b±0.01 | 2.20d ±0.01 | 2.13g ±0.01 |
| OAC | 0.88f±0.03 | 0.72i ±0.01 | 0.68j ±0.01 | 0.65k±0.00 | 1.06c±0.01 | 0.98d±0.00 | 0.92e ±0.00 | 0.85h±0.00 | 2.11a±0.01 | 2.00b±0.00 | 0.90e±0.00 | 0.86g ±0.00 |
| Wettability | 27.05a±0.03 | 27.00b±0.00 | 16.89d±0.03 | 16.80e±0.00 | 15.24i±0.03 | 14.15j±0.03 | 14.10k±0.03 | 13.81l±0.03 | 17.1N5c±0.03 | 16.05f±0.03 | 15.80g±0.03 | 15.72h±0.00 |
| Gelationcapacity | 0.92a±0.90 | 0.91a±0.70 | 0.91a±0.50 | 0.78b±0.78 | 0.91a±0.72 | 0.72c±0.41 | 0.70c±0.91 | 0.70c±0.70 | 0.50d±0.41 | 0.41e±0.92 | 0.41e±0.91 | 0.39e±0.39 |
GelatioTemperatue
| 91.00abc±2.83 | 88.00bc±2.83 | 85.00cd±2.83 | 84.00d±2.83 | 88.00bc±2.83 | 86.00c±2.83 | 81.50d±2.83 | 80.00d±2.83 | 90.00abc±0.00 | 86.00c±2.83 | 83.00d±0.28 | 83.00d±2.83 |
| FoamStability | 6.72e±0.03 | 5.43f±0.03 | 5.10g±0.03 | 5.08g±0.03 | 10.78a±0.03 | 9.56b±0.03 | 8.07c±0.03 | 6.94d±0.03 | 6.22e±0.03 | 5.79f±0.03 | 5.22f±0.03 | 5.00g±0.03 |
| FoamCapacity | 13.69c±0.04 | 12.69f±0.03 | 11.63i±0.03 | 11.29j±0.04 | 14.84a±0.03 | 14.36b±0.03 | 13.27d±0.03 | 12.78e±0.03 | 12.43g±0.03 | 12.30h±0.04 | 9.44k±0.03 | 9.10l±0.03 |
| Viscosity | 0.19a±0.18 | 0.17ab±0.02 | 0.12c±0.18 | 0.11c±0.17 | 0.20a±0.20 | 0.20a±0.18 | 0.19a±0.13 | 0.18a±0.19 | 0.18a±0.18 | 0.18a±0.11
| 0.18a±0.18 | 0.16ab±0.16 |
| pH | 5.99f±0.00 | 5.71g±0.03 | 5.65h±0.00 | 5.59i±0.00 | 6.64a±0.03 | 6.50b±0.00 | 6.44c±0.03 | 6.35d±0.03 | 6.44c±0.03 | 6.34d±0.00 | 6.12e±0.00 | 6.03f±0.03 |
References
-
Abbey, B.W. and Ayuk, E.J. (1991). Functional properties of African yam bean flour (Sphenasylis sternocarpa) Nig J Nutri Sci.; 12:44–46.
--> -
Abiodun O.A. and Akinoso, R. (2014). Physical and Functional Properties of Trifoliate Yam Flours as Affected by Harvesting Periods and Pre-treatment Methods. J. Food Process Technol 5:302.
Publisher | Google Scholor -
Adepeju, A. B., Gbadamosi, S. O., Adeniran, A. H. and Omobuwajo, T. O. (2011). Functional and pasting characteristics of breadfruit (Artocarpus altilis) flours. African Journal of Food Science Vol. 5(9), pp. 529-535.
Publisher | Google Scholor -
Agunbiade, S.O. and Sanni, M.O. (2003). The effect of ambient temperature of cassava tubers on starch quality.pp.180- 194 In: Root crops. The small processor and development of Local food Industries for market economy. Proceedings of the Eight Triennials symposium of the International society for Tropical Root Crops. African Branch, IITA, Ibadan, Nigeria.
--> -
Akubor, P.I. (2003). Functional Properties and Performance of Cowpea/ plantain/ Wheat flour blends in biscuits in Plant foods for Human Nutrition.58 (3):1-8.
Publisher | Google Scholor -
Akomas, E. C. A., Mbanaso, E.C.A and Akoma, O.E.U. (1987). Food forms of cocoyam for home and commercial use. Proceedings of the 1st National Workshop on Cocoyam NRCRI, Umudike, Nigeria, pp. 187-195.
--> -
Alam, F. and Hasnain A. (2009). Studies on Swelling and Solubility of Modified Starch from Taro (Colocasia esculenta): Effect of pH and Temperature. Agriculturae Conspectus Scientificus, Vol 74, No 1, P.: 45-50
Publisher | Google Scholor -
Ali, Z., Malik, R.N. and Abdul, Q. (2013).Heavy metals distribution and risk assessment in soils affected by tannery effluents Chem. Ecol., 29 (2013), pp. 676-692.
Publisher | Google Scholor -
Amandikwa, C. (2012). Proximate and functional Properties of open Air, Solar and Oven dried cocoyam flour. Int’l Journal of Agric. and Rural Dev. 15 (2): 988-994
--> -
Amon, A.S., Soro, R.Y., Koffi, P.K.B., Dué, A.E., Kouamé LP. (2011). Biochemical characteristics of lour from Ivorian taro (Colocasia esculenta, cv yatn) corm as affected by boiling time. Adv. J. Food Sci. Tech.; 3(6): 424 – 435.
Publisher | Google Scholor -
Anele, I. and Nwawuisi, J.U. (2008). Comparison of the effects of three pathogenic fungi on cocoyam storage. Proc.42nd Ann. Conf. Agric. Soc. of Nigeria. Ebonyi State University Abakiliki, pp 183-186.
--> -
Aremu, M.O., Olaofe, O., and Akintayo, E.T. (2007).Functional Properties of some Nigerian varieties of legume seed flour concentration effect on foaming and gelation properties. J Food Technol.;5 (2):109–115.
--> -
Chinnajarn, S., Reungrat Lirnroong, K., Sangnar, A. and Puttakal, W. Y. (2006). Development of Health chip from Jackfruit seed flour. Research Report, Faculty of Science, Burapha University of Chronbir.
--> -
Chukwu, M. N.; Kabuo, N. O. and Nwokocha, N. J. (2018). Effects of fermentation time on the functional properties of ogiri-ahuekere (Arachis hypogaea Linn) seed condiment. International Journal of Biotechnology and Food Science 6(5): 77-85.
Publisher | Google Scholor -
David-Chukwu, N. P.; Onwuka, G. I.; Aji, R. U.; Odom, T. C. and Chukwu, M. N. (2021a). Production, Microbiological and Organoleptic Properties of Stored Cocoyam-based Products. International Journal of Nutrition and Food Sciences. 10(6): 134-143. doi: 10.11648/j.ijnfs.20211006.13
--> -
David-Chukwu, N. P.; Aji, R. U.; Ndukwe, K. O.; Odom, T. C.; Chukwu, M. N. (2021b). Production, Proximate Compositions and Dry Matters of Stored achicha and mpoto - Cocoyam Based Products. International Journal of Nutrition and Food Sciences. 10(6):144-152. doi: 10.11648/j.ijnfs.20211006.14
Publisher | Google Scholor -
David-Chukwu, N. P.; Amadi, A. G.; Onuabuchi, I. C. and Chukwu, M. N. (2022). Influence of storage life and variety on the micro-nutrient compositions of stored cocoyam-based products. Food Ther Health Care.4(2):1-12.
Publisher | Google Scholor -
Davies, E.M., Labuschagne, M., Benesi, M.R.I (2008). “Some properties of starches from Cocoyam (colocacia esculenta) and Cassava (manihot esculenta crants) grown in Malawi”. African Journal of Food Science 2:102-111.
--> -
Eltayeb, A.R.S.M., Ali, A.O., Abou-Arab A-S.F.M. (2011) Chemical composition and functional properties of flour and protein isolate extracted from Bambara ground nut (Vigna subterranean) African J Food Sci.;5(2):82–90.
Publisher | Google Scholor -
Eze, C C. and Okorji, E. C. (2003). Cocoyam production by women farmers under improved and local technologies in Imo State. Nigeria Journal of Science 5(1): 113-116.
--> -
Ezeocha, V.C., Omodamiro R.M., Oti E.and Chukwu, G.O. (2011) Development of trifoliate yam: Cocoyam composite flour for fufu production. Journal of Stored Products and Postharvest Research 2: 184-188.
Publisher | Google Scholor -
Falade, K. and Okafor, C. A. (2015). Physical, functional, and pasting properties of flours from corms of two Cocoyam (Colocasia esculenta and Xanthosoma sagittifolium) cultivars J Food Sci Technol. 52(6): 3440–3448.
--> -
Hayata, M., Alpaslan, M. and Bayer, A.D. (2006). Effect of drying on functional properties of Tarhana. International Journal of Food Science and Technology; 29:457-462.
--> -
Houson, P. and Ayenor, G.S. (2002). Appropriate Processing and food functional properties of maize flour. African Journal of Science and Technology.3:121-126.
Publisher | Google Scholor -
Ibebuchi, C.E. and Uzoegbu, J.O. (2002). Potentials of Wheat- cocoyam Flour blends in biscuit making. Proc.26th. Annual NIFST Conference, Owerri pp 37-38.
--> -
Iwe, M.O. (2003). The Science and Technology of Soyabean. Rojoint communication services LTD, Nigeria, pp. 123-128.
--> -
Jitngarmkusol, S., Hongsuwankul J. and Tananuwong, K. (2008). Chemical Compositions, Functional Properties and microstructure of defatted macademice flours. Food Chem.; 110:23-30.
Publisher | Google Scholor -
Kaur, M., Kaushal, P., Sandhu, K.S. (2013). Studies on Physicochemical and pasting properties of Taro (Colocasia esculenta L.) flour in comparison with a cereal, tuber and legume flour. J Food Sci Technol.
Publisher | Google Scholor -
Kinsella, J.E., Desmondara, S. and German, B.B. (1985). Physical, Chemical and functional Properties of Oil Seed proteins with Emphasis on soy Proteins. Academic Press Inc., New York, pp 107 – 179.
Publisher | Google Scholor -
Landau, S. and Everitt, B. S. (2004). A Handbook of Statistical Analyses using SPSS. Chapman & Hall/CRC Press LLC, New York, USA pp 140-200
Publisher | Google Scholor -
Malomo, O., Ogunmoyela, O.A.B., Adekoyeni, O.O., Jimoh, O., Oluwajoba,S.O. and Sobanwa, M.O. (2012). Rheological and functional properties of soy-poundo yam flour. International Journal of Food Science and Nutrition Engineering 2(6):101-107.
Publisher | Google Scholor -
Manner, H. I. and Taylor, M. (2010). Farm and forestry production and marketing profile for Taro (Colocasia esculenta). In: Elevitch, C. R. (ed), Specialty crops for Pacific Island Agroforestry, Permanent Agriculture Resources (PAR), Holualoa, Hawaii.
--> -
Mbanali, U. G.; Chukwu, M. N. and Iwuagwu, M. O. (2018). Variation in the functional properties of blends of heat-treated local thickening seeds and cocoyam flour. Research Journal of Food Science and Nutrition, 3 (5): 74-83. https://doi.org/10.31248/RJFSN2018.053
--> -
Mbanali, U. G.; Chukwu, M. N. and Iwuagwu, M. O. (2019). Effect of Heat Treatments on Pasting Properties of Local Thickening Seeds and Blending Ratios of Cocoyam Flour. Direct Research Journal of Agriculture and Food Science, 7 (3): 45-53. https://doi.org/10.26765/DRJAFS.2019.5073
--> -
Niba, L.L., Bokanga, M., Jackson, F.I., Sclimme, D.S. and Li, B.W. (2001). Physiochemical properties and starch granular characteristics of flour from various Manihot esculenta (cassava) genotypes. Journal educational Sciences. 67:1701.
Publisher | Google Scholor -
Njintang, Y. N. and Mbofung, C. M. F. (2003). Development of taro Colocasia esculenta L. Schott) flour as ingredient in food processing: Effect of gelatinization and drying temperature on the dehydration kinetics and colour of flour. Journal of food Engineering 58: 259:265.
--> -
Njintang, N. Y., Mbofung ,C.M.F. and Kesteloot, R. (2007a). Multivariate analysis of the effect of drying method and particle size of flour on the Instrumental texture characteristics of paste made from two varieties of taro flour. Journal of food Engineering, 81:250-256.
Publisher | Google Scholor -
Njintang, Y.N., Mbofung, C.M.F., Moates, K.G., Parker, L., Fauld, C.B. and Smith, A.C. (2007b) Functional properties of five varieties of taro flour and relationship to creep recovery and sensory characteristics of achu (taro based paste) J Food Eng.
Publisher | Google Scholor -
Obiegbuna, J.E. Ishiwu, C.N. Akubor, P.I. and Igwe, E.C. (2014). Effect of Processing and storage Relative Humidity on Selected Functional Properties of Cocoyam (Colocasia Esculenta) Corm Flour. Food Science and Quality Management. Vol.28, 2014
Publisher | Google Scholor -
Onimawo, I. A and Akubor, P.I. (2012). Food Chemistry (integrated Approach with Biochemical background). 2nd ed. Joytal Printing Press, Agbowo, Ibadan, Nigeria.
--> -
Onwuka, G. I. (2018). Food analysis and instrumentation: theory and practice. Naphtali Prints, Lagos, Nigeria pp. 179-228.
--> -
Onyeka, J. (2014). Status of Cocoyam (Colocasia esculenta and Xanthosoma spp) in West and Central Africa: Production, Household Importance and the Threat from Leaf Blight. Lima (Peru). CGIAR Research Program on Roots, Tubers and Bananas (RTB).
Publisher | Google Scholor -
Osundahusi, O., Fagbemi, T., Kesselman, E. and Shimoni, E. (2003). Comparison of the Physiocochemical properties and pasting characteristics of flour and starch from red and white sweet potato cultivars. Journal of Agriculture and food Chemistry, 51: 2232-2236.
Publisher | Google Scholor -
Owuamanam, C. I., Ihediohanma, N.C. and Nwanekezi, E.C.(2010). Sorption Isotherm, Particle size, Chemical and Physical properties of Cocoyam corm Flours, Researcher, 2(8), pp. 1-9.
Publisher | Google Scholor -
Peter-Ikechukwu, A. 1.; Ibeabuchi, J. C.; Eluchie, C. N.; Agunwa, I. M.; Aneke, E. J.; Chukwu, M. N.; Ogbuagu, J.C. and Okafor, D.C. (2019). Functional Properties of Sausage Rolls Made from Cocoyam and Wheat Flour Enriched with Soybean Flour. Food Science and Nutrition Studies 3(2):39-53. http://dx.doi.org/10.22158/fsns.v3n1p39
--> -
Peter-Ikechukwu, A. I.; Ogazi. C. G.; Uzoukwu, A. E.; Kabuo, N. O. and Chukwu, M. N. (2020). Proximate and Functional Properties of Composite Flour Produced With Date Fruit Pulp, Toasted Watermelon Seed and Wheat. J Food Chem Nanotechnol 6(3): 159-166. https://doi.org/10.17756/jfcn.2020-096
--> -
Sai-Ut, S., Ketnawa,S.,Chaiwut, P.,Rawadkuen, S. (2009). Biochemical and functional properties of proteins from red kidney, navy and adzuki beans.Asian J. Food Agro- Ind.; 2(4): 493-504.
Publisher | Google Scholor -
Sanni, L.O., Akingbala, J.O., Oguntunde, A.O. Bainbridge, Z.A., Graffthan, A.J. and Wesby, A. (2006). Processing of Fufu from cassava in Nigeria: Problems and Prospects for D evelopment.
Publisher | Google Scholor -
judasilveira88@gmail.com
Publisher | Google Scholor -
Udensi, E.A., Oselebe, H.O. and Iweala, O. O. (2008). The investigation of chemical composition and functional properties of water yam (Dioscorea alata): Effect of varietal differences. Pak Journal of Nutr. 2008; 7(2): 342-344.
Publisher | Google Scholor -
Zhou, T., Zhang, T., Liu, W. and Zhao, G., (2011). Physiocochemical characteristics and functional properties of grape (Vitis vinifera L.) seeds protein. International Journal of Food Science and Technology, 46, 635-641.
Publisher | Google Scholor -
37. Seifu T. Ethnobotanical and ethnopharmaceutical studies on medicinal plants of Chifra district, Afar region, North Eastern Ethiopia. PhD Thesis. Addis selected medicinal plants of Margalla Hills and surroundings. J Med Plants Res. 2011;5(25):6017–23.
Publisher | Google Scholor -
38. Singh N., Mishra S., Mondal A., Sharma D., Jain N., Aseri G.K. Potential of Desert Medicinal Plants for Combating Resistant Biofilms in Urinary Tract Solberg SO, Göransson M, Petersen MA, Yndgaard F, Jeppson S. Biochem. Syst. Ecol. 2016; 66:351–357.
Publisher | Google Scholor -
39. Srinivasan K., Cumin (Cuminum cyminum) and black cumin (Nigella sativa) seeds: traditional uses, chemical constituents, and nutraceutical effects Food. Sper 1983; 5911: 1639–1643 40. Surjushe A, Vasani R, Saple DG. Aloe vera: A short review. Indian J Dermatol. 2008; 53:163–166.
Publisher | Google Scholor -
41. Tuncturk, R.; Tuncturk, M. Effects of Different Phosphorus Levels on the Yield and Quality Components of Cumin (Cuminum Cyminum L.). Res. J. Agric. north-east Bosnia and Herzegovina,” Journal of Ethnopharmacology, vol. 133, no. 3, pp. 1051–1076, 2011.
--> -
42. Vasisht, K.; Kumar, V. Compendium of Medicinal and Aromatic Plants; ICS-UNIDO: Trieste, Italy, 2004; Volume 1, p. 124.
--> -
43. Verykokidou-Vitsaropoulou E, Vajias C. Methylated flavones from Teucrium polium. Planta Med 1986; 52: 401–402.
-->