RESEARCH ARTICLE
1Department of Pure and Industrial Chemistry, Faculty of Physical Sciences, College of Natural and Pharmaceutical Science, Bayero University Kano, P.M.B 3011, Kano State, Nigeria
2Department of Chemistry, Faculty of Science, Confluence University of Science and Technology, Osara. Km 19 Okene-Lokoja Road, P.M.B. 1040 Osara, Kogi State, Nigeria.
3Department of Science Education, Faculty of Science and Technology Education, Confluence University of Science and Technology, Osara, Kogi State, Nigeria
*Corresponding Author: : I.Jimoh* 1, 3Department of Science Education, Faculty of Science and Technology Education, Confluence University of Science and Technology, Osara, Km 19 Okene-Lokoja Road, P.M.B. 1040 Osara, Kogi State, Nigeria. ibrahimj@custech.edu.ng, +234(0)703129794
Citation: I.Jimoh* 1,2, The Removal Of Cu (II), Zn (II), And Cd (II) Ions From Aqueous Solutions Through Adsorption Of Sorghum Vulgare: A Comparative Analysis Using Batch Adsorption Techniques, New Healthcare Advancements and Explorations, vol 1(2). DOI:https://doi.org/10.64347/3066-2591/NHAE.002
Copyright: © 2024, I.Jim oh* 1,2, this is an open-access article distributed under the terms of The Creative Commons Attribution License, which permits unrestricted use, distribution, and reproduction in any medium, provided the original author and source are credited.
Received: October 16, 2024 | Accepted: October 28, 2024 | Published: October 31, 2024
Abstract
Sorghum vulgare (Guinea corn stalk), an agricultural waste material, was employed as an adsorbent to eliminate Cu, Zn, and Cd from simulated wastewater through a batch adsorption method. The study investigated the impact of various adsorption characteristics, including the effects of mixing duration, amount of adsorbent, adsorbent particle size, starting concentrations, and initial pH on the adsorption process.The adsorbent was characterized by its physicochemical properties (moisture content, ash content, and organic matter content), functional groups utilizing Fourier transform infrared (FTIR) spectroscopy for analysis and examining surface morphology with scanning electron microscopy (SEM). The adsorption percentage on GCS increased as the agitation duration extended from 5 to 240 minutes, adsorbent dosage ranging from 100 to 500 mg, and initial concentration between 100 and 300 mg/dm3. The efficiency of the adsorption process was affected by the pH level of the metal solution.. The FTIR spectra indicated decreases in band intensities and vibrational shifts, implying the participation of carbonyl (-C=O), hydroxyl (-OH), and amino (-NH2) functional groups on the surface of the adsorbent during the adsorption and interaction with the ions. The variations in surface morphology between untreated and metal-loaded adsorbents, marked by irregular and porous textures, confirmed the ion adsorption by GCS. This research highlights that GCS is a potential low-cost adsorbent for efficiently eliminating heavy metals from wastewater and other aqueous effluents, demonstrating a high adsorption capacity. The order of adsorption based on initial concentration is Cd, Zn, and Cu.
Keywords: Adsorption; Sorghum vulgare (GCS); Cu (II), Zn (II), and Cd (II) ions.
Introduction
Contamination of drinking water and agricultural products by toxic heavy metals remains a serious and persistent issue [3]. Different industries, such as electroplating, pigment manufacturing, metallurgical processes, mining, and leather production, discharge varying concentrations of heavy metals. Frequently observed metal ions in both natural and industrial effluents include Cd, Cr, Cu, Pb, Zn, Mn, Ni, and Fe [4].
Contaminated wastewater can easily infiltrate surfaces and groundwater, posing a significant concern for those relying on these sources for drinking water. Recently, there has been increased focus on environmental contamination by heavy metals due to their high toxicity and non-biodegradability [6]. Various approaches have been established to treat effluents containing Cu (II), Zn (II), and Cd (II) ions. These methods include chemical precipitation, oxidation or reduction.
electrochemical treatment, ion exchange, reverse osmosis, filtration, and evaporation recovery [2]. However, these techniques frequently have limitations, such as complicated treatment processes, high expenses, and the generation of toxic chemical sludge. Consequently, there has been a shift towards exploring biosorption as an alternative to traditional physical-chemical methods [25]. Biosorption offers advantages like effective metal removal, cost-efficiency, and environmental friendliness. Consequently, studies have concentrated on utilizing affordable agricultural by-products, including maize cob, neem biomass, and rice straw, for the removal of metal ions from water and wastewater. This study seeks to evaluate the adsorption effectiveness of Sorghum vulgare (guinea corn stalks) in removing copper, cadmium, and zinc metal ions from aqueous solutions using a batch process.
Materials And Methods
Materials:
Sorghum vulgare (GCS)
The Sorghum vulgare (GCS) used in this research was obtained from a local farm near Lokoja, Kogi State.
Reagents
All chemicals used in this study were of analytical grade, including copper nitrate trihydrate, zinc nitrate hexahydrate, and cadmium nitrate tetrahydrate, with purity levels of 99%, 99.99%, and 99%, respectively.
Equipment
The equipment employed in this research comprised a centrifuge (Fisher Scientific Centric Model 228), desiccator, Ohaus analytical standard weighing balances (Model AS260D), pH meter, sieves, mortar and pestle, thermometer, dropping pipette, syringes, stirrer, wash bottle, spatula, oven, filter paper, and aluminum foil.
Methods
Preparation of Standard Solutions:
0.1 M hydrochloric acid solution
To prepare 1000 cm³ of a 0.1 M hydrochloric acid solution, 8.20 cm³ of concentrated analar grade HCl (36.5% HCl) was diluted with distilled water to reach a final volume of 1000 cm³. The process started by filling the volumetric flask halfway with distilled water to avoid any vigorous reactions. A clean 10 cm³ pipette was used to carefully transfer the concentrated HCl into the flask. The flask was then filled to the calibration mark, using a dropping pipette for the final few milliliters. The solution was thoroughly mixed by inverting and shaking the flask, transferred into a clean, dry storage bottle, and labeled[2].
0.1 M Sodium Hydroxide
To prepare 1000 cm³ of a 0.1 M sodium hydroxide solution, 4 g of NaOH pellets (99% purity) were dissolved in a 250 cm³ beaker, then transferred to a 1000 cm³ volumetric flask. Distilled water was added up to the calibration mark, and the solution was stored in a labeled bottle for future use. [2].
Copper Standard
To prepare a copper standard solution, 3.80315 g of Cu(NO₃)₂·H₂O (99% purity) was dissolved in 250 mL of distilled water and subsequently diluted to a final volume of 1 liter in a volumetric flask with more distilled water. [9].
Zinc Standard
To prepare a zinc standard solution, 4.5420 g of Zn(NO₃)₂·6H₂O (99.99% purity) was dissolved in 5 mL of distilled water, followed by the addition of 25 mL of 5 M hydrochloric acid. The solution was then diluted to a total volume of 1 liter in a volumetric flask with distilled water.[2].
Cadmium Standard
To prepare a cadmium standard solution, 2.7422 g of Cd(NO₃)₂·4H₂O (99% purity) was dissolved in 250 mL of distilled water and subsequently diluted to a final volume of 1 liter in a 1000 cm³ volumetric flask with more distilled water. [2].
Preparation of Working Standard Solutions
To create working standards with concentrations of 2, 4, 6, 8, and 10 ppm for Cu, Zn, and Cd, the concentrated stock solutions of the corresponding salts were diluted accordingly. This process involved filling five 100-cm3 volumetric flasks approximately one-third full with distilled water. The precise volume of the concentrated stock standard solution needed for each desired concentration was then added to the volumetric flask. Distilled water was added to the flask until the bottom of the solution's meniscus was aligned with the calibration mark on the neck of the flask.. After stoppering the flask, it was inverted three times to ensure thorough mixing. The solutions were then transferred to clean, labeled bottles for future use. The equation below was applied to prepare the diluted standard solutions [3]:
C1V1 = C2V2
Where:
C1 = concentration of the analyte in the stock or intermediate standard solution
V1 = volume of stock or intermediate standard to be used
C2 = final concentration of the standard solution to be prepared
V2 = total volume of the standard solution to be prepared
Preparation of Adsorbent Samples
Sorghum vulgare (GCS) samples were cut into pieces and thoroughly washed with tap water, followed by multiple rinses with distilled water to eliminate dust and other soluble substances. The stalks were then air-dried in the shade at room temperature until they became crisp. The dried stalks were ground into a fine powder using a mechanical grinder and dried overnight for 16 hours in an oven set to a temperature of 30 °C. This temperature was chosen to avoid decomposing the active sites of the sample, which can occur if the temperature exceeds 35-45 °C above ambient temperature. The oven-dried GCS powder was then sieved to obtain particle sizes ranging from 75 to 300 µm using an electronic shaker. These fractions were stored in labeled airtight plastic containers according to their particle sizes for future use [9].
Moisture Content Determination
The moisture content of the GCS samples was determined using the method described by Dada et al. [4]. A 15-gram sample of GCS was placed in a clean crucible, and the weight of the crucible with the sample was recorded as W1. The sample and crucible were dried overnight in an oven at 115 °C for 16 hours until a constant weight was achieved, recorded as W2. This process was repeated in triplicate, and the moisture content was reported as the mean percentage weight loss of the evaporated sample based on the oven-dry weight using the following relationship [10]:
Moisture content (%) = ×100
Where:
(W2 – W3) = the weight of evaporated water.
(W2 – W1) = the oven-dry weight of the sample
W1 = the weight of the empty heated crucible
W2 = the weight of the sample and crucible before heating.
W3 = the weight of the sample and crucible after heating.
Ash Content Determination
The ash content of the adsorbent (GCS) sample was determined following the procedure outlined by Sluiter et al. [24]. A marked 50 cm3-ashing porcelain crucible was first placed in a muffle furnace at 600 °C for four hours. After ashing, the crucible was cooled for one hour and then transferred directly from the furnace to a desiccator. Its weight was measured and recorded to the nearest 0.1 mg.
A 10 g GCS sample, which had been oven-dried at 105 °C and stored in a desiccator, was then weighed into the pre-ashed crucible, and the initial weight of the crucible with the sample was recorded. The crucible containing the GCS sample was placed in the muffle furnace and ashed at 600 °C for four hours until a constant weight was achieved. The final weight of the crucible with the ashed sample was recorded as WC. A constant weight is defined as a change of less than 0.3 mg in the weight of a sample after one hour of reheating.
The Ashing analysis was performed in triplicate. The percentage ash content of the GCS was calculated using the following formula, and the mean of the triplicate values was reported as the ash content on an oven-dry weight basis [6]:
Percentage Ash Content = ×100 … ………. ….. (2)
Where:
W1 = initial weight of the empty crucible;
W2 = weight of the crucible with the sample before ashing;
WC = weight of the crucible with the sample after ashing.
Determination of Organic Matter Content
The organic matter content of the adsorbents was calculated by subtracting the percentage ash content from 100% of the oven-dried sample. This method follows the procedure described by Sluiter et al. [24]. The calculation is represented by the following equation:
Organic Matter Content (%) =100% - percentage ash content………… (3)
Sample Digestion
Sample digestion was carried out following the method described by Deepalakshmi et al. [5]. Approximately 0.3 g of plant material was weighed into a 250 mL Erlenmeyer flask, to which 5 mL of 1:1 HNO₃ was added. The mixture was heated on a hot plate to 95 °C and refluxed for 15 minutes without boiling. After cooling, 2.5 mL of concentrated HNO₃ was added, and the sample was refluxed again at 95 °C for 30 minutes without boiling. This step was repeated once more. Next, the sample was evaporated to a volume of 5 mL without boiling. After cooling, 2 mL of distilled water was added, followed by the slow addition of 3 mL of 30% H₂O₂. The solution was heated until effervescence subsided. Then, 6 mL of 30% H₂O₂ was added in 1 mL increments, and the solution was refluxed. After cooling, 2.5 mL of concentrated HCl was added, and the sample was refluxed for 15 minutes without boiling.
Upon cooling to room temperature, the sample was filtered using Whatman No. 1 filter paper and diluted to 50 mL with double-distilled water. All samples were prepared and analyzed in triplicate.
Batch Adsorption and Optimization Studies
Batch adsorption experiments for Cu, Zn, and Cd ions were performed using the method outlined by Suyamboo and Perumal [25]. The study investigated the influence of various parameters, including contact time (5-240 minutes), adsorbent dosage (100-500 mg), particle size (<75>300 µm), initial metal solution concentration (5-300 mg/L), and initial metal solution pH (2-12). These experiments were conducted at a constant agitation speed of 300 rpm and room temperature (25 °C) in triplicate.
To conduct the adsorption measurements, different amounts of adsorbent were mixed in 150 cm3 Erlenmeyer flasks containing 50 cm3 of metal solution with a known concentration. The initial pH of the heavy metal solutions was adjusted to the desired value by adding a few drops of 0.1 M HCl or 0.1 M NaOH aqueous solutions. The solutions were agitated using an orbital shaker for a predetermined time to reach equilibrium.
After agitation, the samples were filtered using Whatman No. 41 filter paper, discarding the first few drops (3–4) of the filtrate. The filtrates were then centrifuged using a Thermo Fisher laboratory bench-top centrifuge (LC2201) for 30 minutes, and the clear supernatant solution was used for analysis with an atomic absorption spectrophotometer (AAS). Each data point was reported as an average of triplicate readings.
The percentage adsorption and substrate equilibrium adsorption capacity () were calculated using the following equations:
Percentage Adsorption = x 100 …………………..(4)
(mg/g) = ………………………………...(5)
Where:
C0 = Initial concentration of the metal ion (mg/L)
Ce = Equilibrium concentration of the metal ion (mg/L)
V = Volume of the solution (L)
m= Mass of the adsorbent (g)
Effect of Agitation Time
The adsorption experiment was conducted in a batch system at room temperature (30 °C) to study the impact of contact time on metal ion adsorption. This was performed in triplicate, following methods similar to those described by Aljebori and Alshirifi [1] and Eliagwu et al. [6].
In each experiment, 50 cm3 of a copper salt solution with an initial concentration of 100 mg/L was mixed with 500 mg of GCS sample with a particle size of 150 µm and placed in a 250 cm3 conical flask. The mixture was agitated in a rotary shaker at 300 rpm for 5 minutes and then filtered into a 100 cm3 volumetric flask. This process was repeated using the same amount of GCS for various contact times of 10, 15, 30, 45, 60, 120, 180, and 240 minutes. After each agitation period, the contents were filtered using Whatman No. 41 filter paper. The residual concentrations of the metal ion solutions in the filtrate were then analyzed using atomic absorption spectroscopy (AAS).
The same procedure was applied to cadmium and zinc. The equilibrium concentration of each metal in the filtrate was determined using equation (5).
Effect of pH
The effect of the initial pH of the solution on the adsorption of metal ions by GCS was examined in triplicate, following a procedure similar to that of Sarioglu and Atay [22]. For each experiment, 50 cm3 of copper solution with an initial concentration of 100 mg/L was used. The pH of the metal ion solution was adjusted to values of 2, 4, 6, 8, 10, and 12 by adding either 0.1 M NaOH or HCl aqueous solutions. The pH was measured using a Jenway 3320 pH meter, and the solution was stirred until the desired pH was reached.
Next, 0.5 g of GCS sample was added to the solution, and the mixture was agitated in an orbital shaker at 300 rpm for 1 hour. After agitation, the solution was filtered through the Whatman No. 41 filter paper. The residual metal ion concentrations in the filtrate were then analyzed using atomic absorption spectroscopy (AAS).
This procedure was repeated for cadmium and zinc. The equilibrium concentration of each metal in the filtrate was determined using equation 5 [2].
Effect of Adsorbent Concentration
The impact of varying initial concentrations on the adsorption of metal ions by GCS was investigated using a procedure akin to that described by Samarghandi et al. [20]. For each experiment, 0.5 g of GCS was added to separate 250 cm3 conical flasks, each containing 50 cm3 of copper solution with initial concentrations of 5, 50, 100, 150, 200, and 300 mg/L.
The mixtures were shaken for 1 hour and then filtered through the Whatman No. 41 filter paper. The residual concentration of copper in the filtrate was measured using atomic absorption spectroscopy (AAS). This procedure was similarly applied to cadmium and zinc solutions. The equilibrium concentration of each metal ion in the filtrate was calculated using equation (5) [9].
Effect of Adsorbent Dosage
The effect of varying adsorbent dosage on metal ion adsorption was examined by adjusting the amount of GCS from 2 to 20 g/L (0.1, 0.2, 0.3, 0.4, and 0.5 g). This procedure was based on methods similar to those outlined by Sarioglu and Atay [22].
In each experiment, 1 g of GCS (with a particle size of 150 µm) was added to a 250 cm3 conical flask containing 50 cm3 of a copper solution with an initial concentration of 100 mg/L. The mixture was agitated for 1 hour and then filtered through the Whatman No. 41 filter paper. The residual copper concentration in the filtrate was measured using atomic absorption spectroscopy (AAS).
The same procedure was applied to solutions of cadmium and zinc. The equilibrium concentration of each metal ion in the filtrate was calculated using equation (5) [10]
Effect of Temperature
To assess the effect of temperature on metal ion adsorption, 100 cm3 samples of metal ion solutions were placed into separate 250 cm3 flasks, each corked and labeled. For each flask, 1.0 g of the adsorbent was added. The flasks were then agitated in an orbital shaker at different temperatures (30°C, 35°C, 40°C, 45°C, and 50°C) for 1 hour.
After agitation, the samples were filtered, and the residual concentrations of copper ions in the filtrate were measured using atomic absorption spectroscopy (AAS). This procedure was similarly applied to solutions of cadmium and zinc [6].
Batch Adsorption of Mixed Solution of Cu, Cd, and Zn ions.
The batch adsorption experiments for mixed solutions of Cu, Cd, and Zn ions were conducted at room temperature (30 °C). The effects of contact time on metal ion adsorption were evaluated in triplicate, following a method similar to that described by Igwe and Abia [13].
In each experiment, 50 cm3 of a mixed metal salt solution with an initial concentration of 10 mg/L was added to a 500 mg sample of GCS with a particle size of 150 µm, placed in a 250 cm3 conical flask. The mixture was agitated in a rotary shaker at 300 rpm for 60 minutes and then filtered into a 100 cm3 volumetric flask. This process was repeated using the same amount of GCS for a mixed metal solution with a concentration of 100 mg/L.
After filtering through the Whatman No. 41 filter paper, the residual concentrations of the metal ions in the filtrate were analyzed using atomic absorption spectroscopy (AAS). The equilibrium concentration of each metal in the filtrate was calculated using equation 5.
Fourier Transform Infra-Red (FTIR) Spectroscopy
Fourier transform infrared (FTIR) spectroscopy was employed to analyze both the raw GCS adsorbent and the adsorbent after it had interacted with various metal ions. This analysis aimed to characterize the adsorbent and elucidate the mechanism of metal ion binding to the biomass. The FTIR spectra for both the raw and metal-loaded adsorbents were recorded using a CARY 630 FTIR spectrophotometer from Agilent Technologies. Measurements were conducted across a wave-number range of 600–4000 cm-1. The Attenuated Total Reflection (ATR) method was used for this analysis. This technique involves pressing the sample against a high-refractive-index prism and measuring the infrared spectrum by detecting the infrared light that is internally reflected within the prism. No preliminary sample preparation was required for this procedure [2, 9].
Scanning Electron Microscopy (SEM):
The morphological and surface characteristics of the GCS samples were examined using scanning electron microscopy (SEM). The analysis was performed with a Philips XL30 scanning electron microscope, operating at an accelerating voltage of 15 kV, a beam size of 3.0, and a working distance of 10 mm, with a magnification of 8000x.
Before analysis, the samples were coated with a thin layer of carbon in a vacuum to prevent the buildup of static electric charges on the particle surfaces. Multiple images of both the raw and metal-loaded samples were captured to assess their structural features [2].
Results
Fourier Transform Infrared (FTIR) Spectroscopy Fourier transform infrared (FTIR) spectroscopy was utilized to analyze the molecular interactions between the sample and the heavy metal ions. The spectroscopy provided data on various peak intensities, which facilitated the identification of functional groups participating in the adsorption process. The FTIR spectra for the adsorbent, both before and after metal ion adsorption, are illustrated in Figures 1a and 1b.
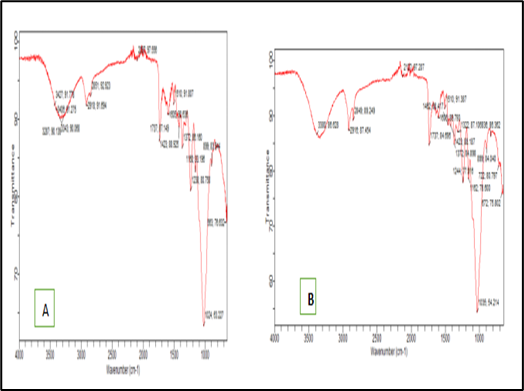
Figure 1a & b: FTIR spectral before and after adsorption of Cu, Cd, and Zn (II) ions onto Guinea Corn Stalk, respectively.
Table 1: Interpretation of FTIR Peaks Observed on GCS Before and Aft Adsorption
| S/n | Before adsorption | After adsorption | Functional groups interpretation |
| 1. | 3380 | 2287 | O-H stretching vibration in carboxylic acid groups (2500-3500cm-1) |
| 2. | 3427 | O-H stretching vibration in carboxylic acid groups (2500 -3500cm-1) | |
| 3. | 2849 | 2851 | O-H stretching vibration in carboxylic acid groups (2500 -3500cm-1) |
| 4. | 2127 | 2097 | N=N-N group due to anti-symmetric stretching (2160-2080cm-1) |
| 5. | 1737 | 1721 | C=O stretching in acid anhydrides (1765-1725cm-1) due to C=O stretching |
| 6. | 1655 | 1655 | General presence of C=O groups stretching vibrations (91650-1800cm-1) |
| 7. | 1639 | 1639 | C=O stretching in tertiary amides (1670-1630cm-1) |
| 8. | 1603 | 1620 | Benzene ring stretching in aromatic compounds (1615-1590cm-1) |
| 9. | 1562 | - | NO2 in aliphatic nitro compounds due to anti-symmetric stretching (1575-1545cm-1) |
| 10. | 1439 | - | OH, in carboxylic and groups due to in-plane OH bending (1440-1400cm-1) |
| 11. | 1316 | - | COO due to symmetric stretching (1400-1310cm-1) |
| 12. | 1242 | 1162 | C-N stretching vibration in amines (1030-1330cm-1) |
| 13. | 1035 | 1035 | C-N stretching vibration in amines (1030-1330cm-1) |
| 14. | 724 | presence of–(CH2) in- in hydrocarbons due to CH2 rocking in methylene chains (740-720cm-1) | |
| 15. | 678 | - | O-C=O in carboxylic acid groups due to O-C- bending (700-590cm-1); C-C-CHO in aldehydic compounds due to C-C-CHO bending (695-635cm-1) |
Scanning Electron Microscopy (SEM)
The Scanning Electron Microscopy (SEM) images of the Guinea Corn Stalk (GCS) are presented in Figures 2a and 2b, depicting the morphology of the material both before and after the adsorption process.
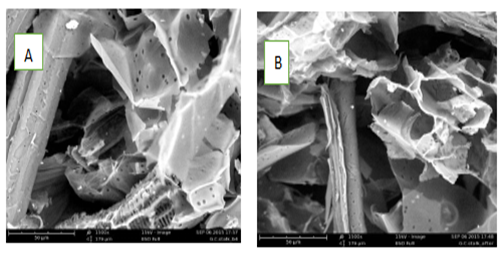
Figure 2a and 2b: SEM for GCS before and after adsorption of Cu, Cd, and Zn (II) ions unto Guinea Corn Stalk respectively.
Physicochemical Properties Investigated
Table 2: Table showing the result of %Moisture content, Ash content, and % Organic matter content for GCS.
| Properties | GCS |
| %Moisture content | 8.40+/-0.07 |
| Ash content | 51.23+/- 0.08 |
| % Organic matter content | 48.77 |
Batch Adsorption and Optimization Studies.
Batch adsorption experiments were conducted to determine the optimal conditions for the adsorption process by varying several operational parameters. These included contact time (5 to 240 minutes), adsorbent dosage (0.2 to 1.0 g), initial salt concentration (10 to 100 mg/L), pH (3.0 to 10.0), and temperature (300 to 333 K). The results, indicating the optimal conditions for each parameter, are summarized in Table3
Table 3: Optimum Conditions for the Adsorption of Cu2+, Zn2+, and Cd2+onto Guinea Corn Stalk
| Salt | Time (min) | w (g) | Co (mg/L) | PH | Temp. (K) |
| Cu2+ | 60 | 0.4 | 5 | 7.2 | 303 |
| Zn2+ | 60 | 0.3 | 5 | 8.5 | 303 |
| Cd2+ | 45 | 0.3 | 5 | 7 | 303 |
The results from the batch experiments conducted on the GCS sample, examining the effects of time, dosage, concentration, and pH, are presented in Figures 4a through 4f.
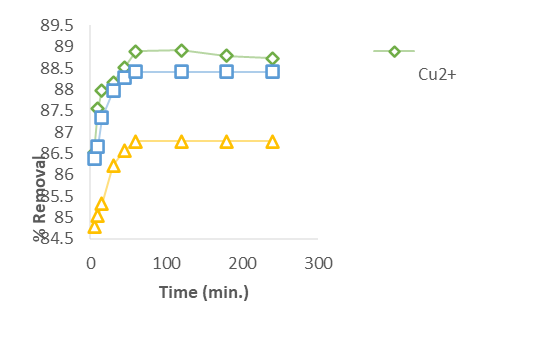
Figure 4a: Effect of the Contact time for the Removal of Heavy metal ions (Cu2+, Zn2+ and Cd2+)
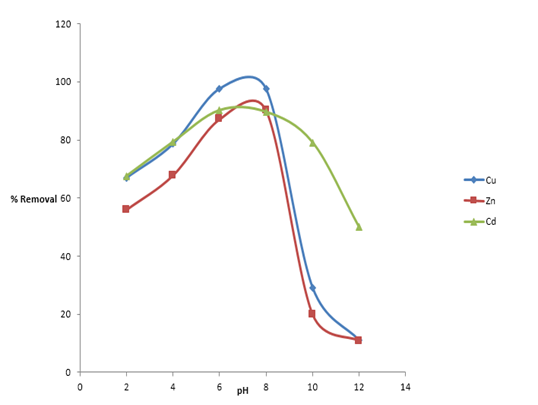
Figure 4b: Effect of Initial pH for the Removal of Heavy Metals ions (Cu2+, Zn2+ and Cd2+)
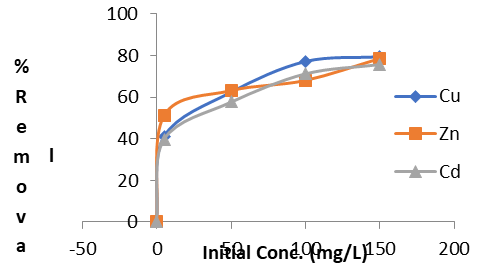
Figure 4c: Effect of Initial Concentration for the Removal of Heavy Metals (Cu2+, Zn2+and Cd2+)
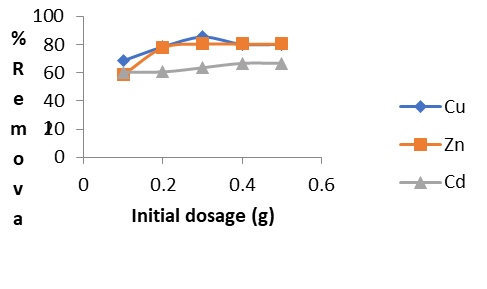
Figure 4d: Effect of Adsorbent Dose for the Removal of Heavy Metals (Cu2+, Zn2+ and Cd2+)
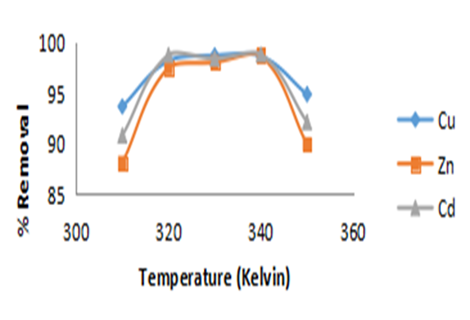
Figure 4e: Effect of Temperature for the Removal of Heavy Metals (Cu2+, Zn2+ and Cd2+)
Comparison of Adsorption for Cu2+, Zn2+and Cd2+ in Single vs. Mixed Component Systems
The adsorption experiments were conducted both in single-component systems and in a mixed-component system containing Cu, Zn, and Cd(II) ions at concentrations of 10 mg/L and 100 mg/L. The results for the mixed-component system are displayed in Figure 4f.
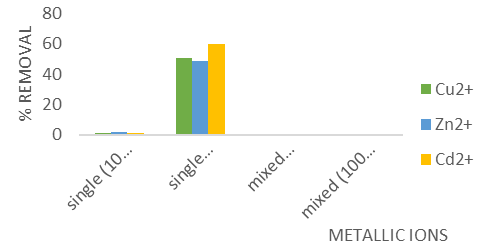
Figure 4f: Effect of Temperature for the Removal of Cu2+, Zn2+ and Cd2+ ions.
Discussion
Fourier Transform infrared (FTIR) spectroscopy The FTIR spectrum of the adsorbent before adsorption, shown in Figure 1a, reveals several absorption peaks that highlight the complexity and heterogeneity of its surface, as noted by Ibrahim and Sani [11]. The spectrum exhibits a peak at 3343 cm⁻¹, indicating the presence of bonded OH groups in oxygen-containing functional groups. Additionally, the FTIR spectrum identifies vibrations at 2918 cm⁻¹ (C–H bonds), 1238 cm⁻¹ (aliphatic C–C bonds), 1605 cm⁻¹ (aromatic C=C bonds), and 1723 cm⁻¹ (carboxylic/carbonyl groups). These vibrations are attributed to cellulose, hemicelluloses, and lignin, which are prevalent in plant materials.
Table 1 summarizes the detected frequencies and their associated functional groups for the GCS. Figures 1a and 1b present the FTIR spectra of the raw GCS before and after the adsorption of Cu, Cd, and Zn(II) ions. The disappearance of certain peaks (e.g., 1562, 1439, 1316, and 678 cm⁻¹) and shifts in vibration frequencies (e.g., from 3380 to 2287 cm⁻¹) following metal ion adsorption indicate successful adsorption, as detailed in Table 1 [3].
Scanning Electron Microscopy (SEM)
Morphological Changes in GCS Before and After Metal Adsorption: Before metal uptake, the GCS exhibited an irregular, flaky, and heterogeneous surface, as shown in Figure 2a. The morphological image suggested that the adsorbent's numerous cavities and high porosity made it a promising material for adsorption. After metal ions were adsorbed, some of these pores were no longer visible, and the surface of the GCS appeared cloudy, indicating the presence of metal ions on the sample. Figure 2b illustrates the uneven distribution of metal ions on the adsorbent's surface post-adsorption. These observed morphological changes align with findings reported in the literature for similar materials [19].
Batch Adsorption and Optimization Studies:
Effect of Contact Time
Figure 4a illustrates the removal efficiency of Cu²⁺, Zn²⁺, and Cd²⁺ over time. The data show a rapid initial uptake of all three metals, similar to findings by Jaber [14], who observed a quick removal of various metal ions using Xanthium pensylvanicum. This initial rapid adsorption is likely due to the abundant active sites available on the adsorbent surface, which strongly attract the metal ions. After the initial phase, the rate of removal gradually levels off, reaching equilibrium around 60 minutes for Cu²⁺, Zn²⁺, and Cd²⁺.
As contact time increases, the quantity of metal ions removed also rises until equilibrium is achieved between 10 and 60 minutes. Beyond 240 minutes, however, further increases in contact time lead to a decrease in adsorption efficiency, suggesting that extended contact times are not beneficial. Specifically, GCS achieved removal rates of up to 161 mg/g (88.92%) for Cu²⁺, 140.85 mg/g (88.41%) for Zn²⁺ within 60 minutes, and 204.08 mg/g (86.78%) for Cd²⁺ within 45 minutes. These results align with findings by Pandey et al. [18], who reported that metal ion removal increases over time until reaching a saturation point.
Effect of Initial pH of the Metals Solutions
The pH of the aqueous solution is a crucial factor influencing adsorption, as it affects the surface properties of the adsorbent, including the ionization of functional groups and surface charge. At lower pH levels, the high concentration of hydronium ions (H₃O⁺) competes with metal ions for binding sites on the adsorbent, leading to decreased adsorption of the metal ions. As the pH increases, the competition between hydronium ions and metal ions diminishes, resulting in enhanced adsorption. However, at higher pH values, adsorption can decrease again due to metal ion hydrolysis and an increased concentration of hydroxyl ions or other anionic species in the solution. The adsorption reactions for the GCS can be represented by the following equilibria:
2M2++ 2GOH ⇌2GOM+ 2H+
2M2+ + 2GOH + 2H2O ⇌2GOMOH + 4H+
where M represents Cd²⁺, Cu²⁺, or Zn²⁺, and OH represents the surface hydroxyl groups on the Guinea Corn Stalk (GCS).
The optimal adsorption of Cu²⁺, Zn²⁺, and Cd²⁺ was achieved at pH values of 6, 8, and 6, respectively, as shown in Figure 4b. The observed decrease in metal ion removal at higher pH levels is attributed to the formation of metal hydroxides: Cd(OH)₂ at pH 7.2, Cu(OH)₂ at pH 7, and Zn(OH)₂ at pH 8.5 [15].
Effect of Initial Concentration of Metals
As illustrated in Figure 4c, the adsorption of metal ions increased with higher initial concentrations of these ions. The elevated concentration creates a stronger driving force, which effectively overcomes the mass transfer resistance between the aqueous phase and the solid adsorbent. Consequently, a higher initial concentration of metal ions enhances the adsorption process. This finding is consistent with observations by Okeimen et al. [17], which indicate that the percentage removal of metals and their uptake depend significantly on the initial concentration of the metal ions in the solution [21].
The adsorption efficiency improved with increasing initial metal ion concentrations, with the minimum removal rates observed at 90.01% for Cu²⁺, 90.21% for Zn²⁺, and 85.94% for Cd²⁺ at an initial concentration of 5 mg/L. This increase in adsorption can be attributed to the greater availability of active sites and a more substantial concentration gradient driving the adsorption process[2]. Additionally, the order of adsorption efficiency based on initial concentration was found to be Cd²⁺ < Zn>
Effect of Adsorbent Dose (g)
Figure 4d demonstrates that the removal efficiency of metal ions improves with an increase in adsorbent dosage. This enhancement is due to the larger surface area and the increased number of available adsorption sites on the adsorbent [11,16]. Specifically, 0.3 g of GCS effectively removes 85.50% of Cd²⁺ and 80.52% of Zn²⁺. In contrast, 0.4 g of GCS achieves a removal rate of 66.67% for Cu²⁺ in a 10 mg/L solution under the same conditions.
Effect of Change in Temperature of the System
The impact of temperature on the adsorption of various metal ions was evaluated while keeping all other experimental conditions constant (Fig. 4e). The results indicate that the adsorption efficiency for all three metal ions decreased as the temperature of the system increased. Although there were minor increases in adsorption at certain temperatures, the overall trend showed a decline in percentage removal with rising temperatures. This observation aligns with the findings of Gunasekar and Ponnusami [8], who studied the removal of methylene blue using teak and guava leaves. Typically, adsorption is an exothermic process, meaning that as the temperature rises, the extent of adsorption generally decreases [27]. This can be attributed to the fact that adsorption often involves Van der Waals forces, which are weak and more easily disrupted at higher temperatures. Consequently, physical adsorption, which is favored in exothermic processes, tends to be more effective at lower temperatures [23].
Batch adsorption of mixed solution of Cu, Cd, and Zn ions.
Figure 4f illustrates that the adsorption of individual metal ions Cu (II), Cd (II), and Zn (II) onto the GCS sample remained consistent in single-component systems. However, in mixed-component systems, the adsorption behavior varied. This observation is consistent with the findings of Igwe and Abia [12], who used maize cob for the adsorption of Cd (II), Zn (II), and Pb (II) ions. The variability in adsorption in mixed systems can be attributed to several factors, given that adsorption is influenced by particle-controlled processes [13]. These factors include:
- The diffusion of solute from the solution to the particle's surrounding film.
- The movement from the film to the particle's surface (external diffusion).
- The diffusion from the surface to internal sites (internal diffusion).
- The uptake mechanisms may involve various processes such as physicochemical sorption, ion exchange, precipitation, or complexation [26].
Conclusion
This study demonstrates that Sorghum vulgare (Guinea corn stalk (GCS) serves as a valuable and cost-effective adsorbent for the removal of Cu²⁺, Zn²⁺, and Cd²⁺ from wastewater and other aqueous effluents. Its effectiveness is attributed to its high adsorption capacity, which is influenced by factors such as contact time, adsorbent dose, and metal ion concentration. The adsorption efficiency observed follows the sequence: Cd ²⁺ < Zn>
References
-
Aljebori A. M. and Alshirifi, A. N. (2012): Effect of Different Parameters on the Adsorption of Textile Dye Maxilon Blue GRL from Aqueous Solution by Using White Marble, Asian J. Chem., 24, 5813-5816.
Publisher | Google Scholor -
Anne, Jibrin (2017): Kinetics and Thermodynamics Studies of the Adsorption of Cu (II), Zn (II) and Cd (II) ions from aqueous phase Guinea corn stalk (Sorghum vulgare). M.Sc. Thesis, Department of Pure and Industrial Chemistry, Bayero University Kano; April, 2017.
--> -
Bharathi, K.S. and Ramesh, S.P.T. (2013): Fixed-Bed Column Studies on Biosorption of Crystal Violet from Aqueous Solution by Citrullus lanatus (Watermelon) Rind and Cyperus rotundus. Applied Water Science, 3, 673-687
--> -
Dada,O.A.,Fayinminnu,O.O., Taiwo,T.O.(2012): Phytoremediation of Pb, Cd and As from urban solid waste compost using Tithoniadiversifolia hemnsl and Ageratum conyzoides L. Annals of West University of Timisoara, series of Biology, XV(2):149–158
Publisher | Google Scholor -
Deepalakshmi A.P, Ramakrishnaiah. H, Ramachandra Y.L., Naveen Kumar N. (2014): Leaves of Higher Plants as Indicators of Heavy Metal Pollution along the Urban Roadways.
Publisher | Google Scholor -
Elaigwu S.E, Usman L.A, Awolola G.V, Adebayo G.B. and Ajayi R.M.K. (2009): Adsorption of Pb (II) from aqueous solution by activated carbon prepared from cow dung. Adv. In. Net. Applied Sci. 3(3), 442-446
Publisher | Google Scholor -
El-Sayed, G.O; H.A. Dessouki and S.S. Ibrahim (2011): The Malaysian Journal of Analytical Sciences, Vol.15, No.1; pp8-21.
--> -
Gunasekar, V. and Ponnusami, V. (2013): Kinetics, Equilibrium, and Thermodynamic Studies on Adsorption of Methylene Blue by Carbonized Plant Leaf Powder. Journal of Chemistry (2013) 6.
Publisher | Google Scholor -
Ibrahim Jimoh and Abdullahi Jimoh (2021): An Evaluation of the Adsorption Kinetics of Cd (II) ions from Synthetic Solution using Powdered Groundnut Shell as Adsorbent. Central Asian Journal of Medical and Natural Sciences, 2(6):104-111; ISSN: 2660-4159. https://cajmns.centralasianstudies.org/ ; https://creativecommons.org/licenses/by/4.0/
Publisher | Google Scholor -
Ibrahim Jimoh and Abdullahi Jimoh (2021): The Experimental Study of Adsorption of Ni (II) from aqueous solution using Chelating Schiff base derived from 2-Aminobenzoic Acid and Benzoin. Central Asian Journal of Theoretical and Applied Sciences, 2(11), 145-152, ISSN: 2660-5317
--> -
Ibrahim, M.B. and Sani, S. (2015): Neem (Azadirachta indica) leaves for Removal of Organic Pollutants. Journal of Geoscience and Environment Protection, (3):1-9.
Publisher | Google Scholor -
Igwe JC, Abia AA. (2003) Maize cob and Husk as adsorbents for the removal of Cd, Pb and Zn ions from waste water. The physical Sci.; 2:210-215
Publisher | Google Scholor -
Igwe JC, Abia AA. (2005): Sorption Kinetics and Intraparticulate diffusivities of Cd, Pb and Zn ions on Maize cob. African Journal of Biotechnology. 4(6):509-512
Publisher | Google Scholor -
Jaber, S. (2013): Removal of Heavy Metals Pb2+, Cu2+,Zn2+, Cd2+, Ni2+, Co2+ and Fe3+ from Aqueous Solutions by using Xanthium Pensylvanicum. Leonardo Journal of Sciences, (ISSN 1583-0233): 97-104
--> -
Jagjit Kour, Puspa LalHomagai, MassimoCagnin, Anthonio Masi, Megh Raj Pokhrel and Kedar Nath Ghimire. (2013): Adsorption of Cd (II), Cu (II), and Zn (II) from Aqueous Solution onto Nitrogen-Functionalized Desmostachya bipinnata Journal of Chemistry Volume, Article ID 649142, 7 pages
--> -
Kundu, S and Gupta, A., K. (2006): Investigation on the adsorption efficiency of iron oxide coated cement (IOCC) towards As (V)-kinetics, equilibrium and thermodynamic studies. Colloid Surf A, Physicochem Eng. Aspects, 273, 121–128.NREL Laboratory Analytical Procedures for standard biomass analysis are available electronicallyat
--> -
Okieimen FE, Okieimen CO, Wuana RA (2013): Preparation and characterization of activated carbon from rice husks. J. Chem. Soc. Nigeria. 32(1):126-136.
Publisher | Google Scholor -
Pandey, P. Sambi, S. S., Sharma, S K and Singh, S. K. (2009): Batch Adsorption Studies for the Removal of Cu (II) Ions by Zeolite NaX from Aqueous Stream. Proceedings of the World Congress on Engineering and Computer Science 2009
Publisher | Google Scholor -
Salleh, M.A.M.; Mahmoud, D.K.; Karim, W.A.W.A.; Idris, A. (2011): Cationic and anionic dye adsorption by agricultural solid wastes: A comprehensive review. Desalination, (280):1–13.
Publisher | Google Scholor -
Samarghandi, M., R., Azizian, S., Shirzad, M., Jafari, S., J.and Rahimi, S. (2011): Removal of divalent nickel from aqueous solutions by adsorption onto modified holly sawdust, equilibrium and kinetics. J Environ Health Sci Eng., 8,181-188
Publisher | Google Scholor -
Saradhi, B.V., Rao, S.R.K., Kumar, Y.P., Vijetha, P., Rao, K.V. and Kalyami, G. (2010): Applicability of Langmuir and Freundlich theory for biosorption of chromium from aqueous solution using Test of Sea Urchins. International Journal of Chemical Engineering Research, 2(2): 139 – 148.
Publisher | Google Scholor -
Sarioglu, M. and U.A. Atay, (2006): Removal of methylene blue by using biosolid. Global NEST J., 8: 113-120
Publisher | Google Scholor -
Sharma, P.; Kaur, H.; Sharma, M.; Sahore, V. (2011) A review on applicability of naturally available adsorbents for the removal of hazardous dyes from aqueous waste. Environ. Monit. Assess. (183):151–195.
Publisher | Google Scholor -
https://pubs.acs.org/doi/abs/10.1021/acs.energyfuels.6b02645
--> -
Suyamboo B.K., Perumal R.S., (2012), Equilibrium, thermodynamic and kinetic studies on adsorption of a basic dye by Citrullus lanatus rind, Iranica Journal of Energy and Environment, 3, 2334.
--> -
Weber WJ. And Digiano FA. (1996): Process Dynamics in environmental science and Technology service. Willey and Sons, New York pp. 89-94
Publisher | Google Scholor -
Weber, W. J., (1972): Physicochemical Processes for Water Quality Control, John Wiley & Sons, Inc., USA, 199-259
Publisher | Google Scholor