RESEARCH ARTICLE
1 Chief, Pediatric and Adult Cardiology, Prakash Heart Station, Nirala Nagar,Lucknow, UP, India.
2 Director, Technical, Prakash Heart Station, Nirala Nagar, Lucknow, UP, India.
3 Cardiac Technician, Prakash Heart Station, Nirala Nagar, Lucknow, UP, India.
4 Lead PMO, Tech Mahindra, New Delhi, India.
*Corresponding Author: Akhil Mehrotra
Citation: Akhil Mehrotra 1* (2024), 4Dimensinal XStrain Echocardiographic Assessment of Left VentricularStrain and Rotational Mechanics: Technology, Clinical Application, Advantages and Limitations1(1). Clinical Cardiology and Cardiovascular Procedures(cccp)DOI: https://doi.org/10.64347/3066-2656/CCCP.001
Copyright: © 2024, Akhil Mehrotra 1*, this is an open-access article distributed under the terms of The Creative Commons Attribution License, which permits unrestricted use, distribution, and reproduction in any medium, provided the original author and source are credited.
Received: January 11, 2024 | Accepted: February 16, 2024 | Published: February 19, 2024
Abstract
Currently, because of its phenomenal ability to non-invasively assess the left ventricular (LV) systolic function, 2Dimensional speckle tracking echocardiography (STE) is being increasingly embraced in numerous echocardiographic laboratories, multinationally. 2Dimensional STE is most sought-after method to evaluate LV strain, rotation, twist and torsion. Two-dimensional (2D), three-dimensional (3D) and 4Dimensional (4D) deformation estimation by STE is intrinsically accompanied with certain limitations. For better appraisal of LV contractile properties recently introduced updated version of 4D XStrain STE has been employed to analyse the various complex multidimensional LV mechanics. This novel technology is a trustworthy, economical and a simplistic tool for estimation of regional and global myocardial function. Furthermore, 4D XStrain STE can accurately quantify the 4D LV ejection-fraction, LV volumes and sphericity index (SI). However, this noteworthy technology has not been extensively implemented and its assessment is still limited to research applications dominantly. Hence, we aimed to familiarize this innovative technology by comprehensively addressing its technique, advantages and limitations, with intent that it may serve a more meaningful purpose in the current volatile scenario of cardio-vascular disease.
Keywords: 4dimensional xstrain echocardiography, lv strain, lv rotation, lv twist, lv untwist, lv torsion.
Introduction
Contemporarily, global longitudinal strain (GLS) automatically derived by STE is the most extensively researched all over the world [1]. After critical evaluation of the enormity of data on GLS, the American Society of Echocardiography recommended a GLS value of > 20 + 2% to be normal [2]. 3D STE requires a single apical acquisition, translating into lessened acquisition duration and an opportune moment to estimate the entire strain components from a solitary cardiac cycle [3]. Conversely, in view of inferior quality of temporal and spatial resolution of 3D STE, its tracking quality is adversely affected. Intermittently, multi-beat acquisition may produce a stitching artifact between sub-volumes, which may result in imprecise speckle tracking analysis [4, 5]. XStrain 4D is a pioneering technology which amalgamates Tomtec GMBH’s 3D/4D portrayal and BeutelTM computing competencies [6]. Consecutively, this unique tool blends the speckle tracking data obtained from apical 3CH, 4CH and 2CH views and eventually renders an exhaustive picture of cardiac function (Figure 1). This tool depending on superior quality of 2D spatial and temporal resolution addresses the various constraints of full volume 3D STE (7-11).
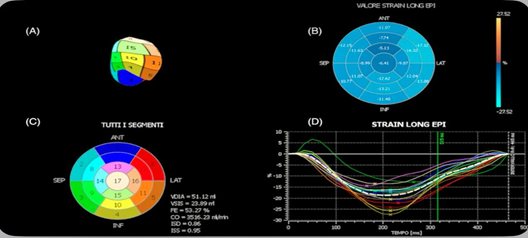
Fig 1: 4Dimensional XStrain speckle tracking echocardiography A), 3D remodelling after sequential structural arrangement; B), Epicardial Bull’s eye deformation values; C), Endocardial Bull’s eye in a 17 segment model ; D), Graphs of trend over time of longitudinal deformation values.
There are considerable differences in strain measurements between 2D and 3D speckle tracking echocardiography (Figure 2). JASE consensus declaration testimonial [13] recognised that limitation of analysis of rapid events of Isovolumic contraction and relaxation was as a consequence of slower frame rates of 3DSTE in comparison to 2D STE.
| Features | 3D deformation | 2D deformation |
| Acquisition | Solitary apical view | Numerous apical and parasternal views |
| Heart rhythm requisite | Regular | Regular |
| Feasibility | Acceptable | Superior |
| Dependence upon excellent image resolution | Yes (++) | Yes (+) |
| Temporal resolution | 34-50 volumes/sec | 40-75 frames/sec |
| Parameters | Entire deformation parameters (longitudinal, radial, circumferential) | Entire deformation parameters (longitudinal, radial, circumferential) |
| Area deformation parameter | Evaluated | Cannot be evaluated |
| Mapping of Bull's-eye | dynamic | Fixed |
| Global strain calculation | Concomitant | Non concomitant |
| Radial strain calculation | Estimated from area strain | Calculated directly |
| Speckles motion | Any direction | Out-of-plane |
| Positive peak principle | Absent | Present |
| Demarcation of end-systole | Minimal volume of LV | Closure of aortic valve |
Fig 2: Comparative features of 2Dimensional and 3Dimensional deformation of LV - (modification of table 1, Muraru et al) [6].
Single plane 3D echocardiography imaging is achieved by the fragmentation of the 3D STE, by tracking the 3D successive volumes within the region of interest by 3D template matching algorithm. Nevertheless, the resultant 3D resolution is of ordinary quality compared to 2D imaging [6]. Image quality being a decisive factor for temporal and spatial resolution, consequently 3D STE is adversely affected in defining the endocardial and epicardial boundaries. Conversely, XStrainTM 4D, devoid of these limitations represents a dependable, ingenious and operator friendly tool for estimation of global and regional myocardial deformation.
The present document comprehensively narrates the systematic approach to technique, clinical applications, advantages and limitations of this outstanding procedure.
4Dimensional Xstrain speckle Tracking Echocardiography
Technique
The echocardiographic evaluation is performed by a qualified and skilled operator and the procedure necessitates acquisition of images using a harmonic variable frequency (1-5 Mhz) electronic single crystal array transducer with patient lying in the left lateral decubitus position [6, 14]. The technique requires a systematized approach for obtaining excellent information of variety of variables of LV deformation, rotation and EF etc.
ECG Gating
Since ECG gating is a salient feature of STE, thus pristine quality of ECG signal is necessary. Efforts should be made to acquire all images at a nearly similar heart rates.
Image Acquisition
2D digital cine loops are acquired with a frame rate of 40-75 frames/sec along with simultaneous ECG gating from apical 3CH, 4CH and 2CH views. A minimum of three cine loops are acquired.
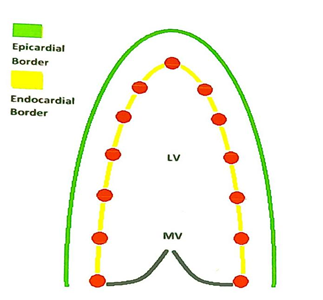
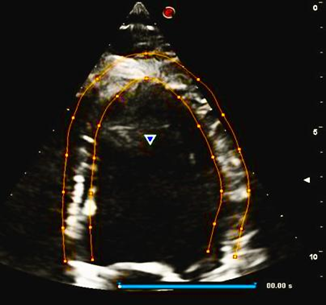
An endocardial frame with a clearly outlined endocardial and epicardial border is selected. The border is demarcated by 13 equidistant tracking point (Figure 3) which automatically aligns over tracking points, under the supervision of a border segmentation tool-AHS, Aided Heart Segmentation.
The LV wall of each apical view was automatically divided into 6 segments and tracked throughout the cardiac cycle. The tracking quality was optically assessed and it was considered appropriate if the movements of tracking points tagged along the endocardial border throughout the entire cardiac cycle. When required manual adjustment of tracking points was performed. The cardiac cycles with decent tracking quality and absence of arrhythmia are selected for off-line analysis
(Fig3: A)
(Fig3: B)
Fig 3: A) Diagramatic illustration of 4D XStrain STE border mapping by inserting 13 equidistant points on the endocardium of the LV cavity; B), The similar procedure being followed in one of our study subjects.
Offline Analysis
2D STE analysis is implemented off-line by the same operator, employing XStrain-4DTM (Esaote, Italy) software package, which is a dedicated border tracking application [14]. The principal purpose of XStrain-4DTM is to amalgamate and systematically refine the information gathered from three 2D apical views. After 3D reformation, the XStrain-4D software furnishes values of multitudinal segmental, regional and global deformation and rotational parameter [14]. Moreover, the “Beutel model” method (Tomtech, Germany) of X4D-EF [15-17], quantifies the 4D LV volumes, EF, CO and sphericity index in diastole and systole. Finally LV bull’s eye plot is portrayed in a 17-segment model [14]. Graphics and curves of the estimated parameters are displayed and numerous strain, strain rate, displacement and velocity indices are elucidated from the endocardial regions of myocardium (Figure 4-6). LV global and regional mean values of deformation of endocardial of variables are mentioned as displacement (mm), velocity (mm/sec) strain (%) and strain rate (1/sec).
a)  b)
b)
c) d)
d)
e) f)
f)
Fig:4 a) Apical 3CH GLS analysis, b) Apical 4CH GLS analysis, c) Apical 2CH GLS analysis, d) GLS - Bull’s eye graph and plot, e) GLS - Bull’s eye plot, f) longitudinal time to peak strain plot.
a) b)
b)
c) d)
d)
e) f)
f)
Fig 5: a) LV GLS, b) GLSR, c) LV GCS, d) LV GCSR, e) LV GRS, f) LV GRSR , global longitudinal strain, GLSR, global longitudinal strain rate, GCS, global circumferential strain, GCSR, global circumferential strain rate, GRS, global radial strain, GRSR, global radial strain rate.
a) b)
b)
Fig 6: a) 3-dimensional reconstruction of the 2-dimensional three apical views by 4DXStrain software, b) determination of 4D volumes, EF%, cardiac output and sphericity index in diastole and systole.
Special Precaution to accomplish high quality 4D XStrain Speckle Tracking Echocardiography [18]
It is critical to obtain high quality 4D XStrain STE images and and certain instructions need to be adhered while acquiring the images.
- Special attention is to be paid to obtain a finest quality of ECG tracing; adjust the position of electrodes on the chest and choose the lead (from PHYSIO menu of the echocardardiography system) that displays the smoothest trace, with well defined R/Q waves with minimal noise; avoid traces with prominent P or T waves, as they will interfere with gating during 4D XStrain STE data acquision
- The operator must ascertain whether the subject can cooperate for breath holding maneuvers; to avoid translation motion and breathing artifacts; breath holding must be ensured while acquiring the data.
- LV should occupy in most of the image sector and avoidance of foreshortening is imperative.
- While performing the endocardial tracking care should be taken to avoid the papillary muscles bulges in LV cavity.
- For evaluation of LV circumferential and radial strain, rotation and twist, excellent quality of images of short axis views at the mitral valve (MV) level, papillary muscle level (PM) and apical level are obligatory.
- The software automatically calculates the rotation parameters. Conventionally, a positive value is designated to anticlockwise rotation and a negative value for clockwise rotation; thereby apical rotation is positive and the basal rotation is negative .
- Calculation of LV twist is achieved by subtracting the basal from the apical rotation and torsion by dividing the twist value by the length of LV (Figure 7).
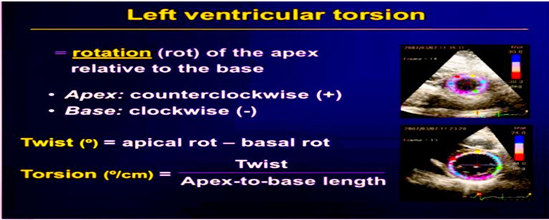
Fig 7: Calculation of LV twist and torsion
Parameters derived from 4D XStrain STE
Myriads of parameters can be derived from the updated version of 4D XStrain STE
Deformation Parameters
Longitudinal strain (GLS), global longitudinal strain rate (GLSR), global circumferential strain (GCS), global circumferential strain (GCSR), global radial strain (GRS), global radial strain rate (GRSR), transverse strain, transverse strain rate, transverse velocity, longitudinal velocity, radial velocity, rotational velocity, shear and shear rate. Negative values are assigned to GLS and GCS and on the other hand GRS is designated with positive values. Likewise, the values of %, 1/sec, and cm/sec were assigned to strain, strain rate and velocity respectively.
Rotational Parameters
The rotational parameters derived are outlined: peak apical rotation, time to peak apical rotation, peak twist, time to peak twist, twist rate, time to peak twist rate, untwist rate and time to peak untwist rate (Figure 8). The values of rotation, twist, untwist rate and time to untwist rate are demarcated in 0, ms, 0/s where appropriate.
a) b)
b)
c) d)
d)
Fig 8: a) LV twist mechanism basal segment revolves in a counter clockwise course and apex resolves in a clockwise route. L, distance between base and apex. b), c), and d) are images of graphs of LV rotational twist parameters generated by the XStrain4DTM software
Volumetric Parameters
LV volumes is diastole and systole, cardiac output (CO) 4D-EF%
and sphericity index (SI)
Clinical Application
In various and diversified clinical setting STE has proved to be an invaluable tool for detection of subclinical LV systolic dysfunction. The application of this promising technology has shown exponential increments in the last decade as evidence by abundant published research and scientific literature on this approach.
On perusing the academic literature we encountered multiple studies of XStrain 4D STE in manifold clinical disease states: congenital heart disease, coronary artery disease, Hypertrophic cardiomyopathy, dilated cardiomyopathy, amyloidosis, psoriasis, acute myocarditis, progressive systemic sclerosis etc. Remarkably, a significant number of research studies have already been published in healthy adult population (12, 13, 17-22) with the aim to determine the normative value ranges of several strain, rotation and twist parameters.The current evidence of clinical applications of XStrain 4D STE is summarized below
- Coronary Artery Disease
GLS was significantly impaired in the region of myocardial infarction [23-25]. Additionally the authors noted that there was a parallel reduction of strain values within the infarcted myocardium. In patients of recent non ST elevation myocardial infarction (NSTEMI) undergoing percutaneous coronary intervention (PCI) D'Andrea et al [23] outlined the effectiveness of global and regional longitudinal strain when assessed by XStrain 4D STE. The authors acknowledged that strain values were achievable in 95% of LV segments; akinetic segments showed more myocardial deformation which did not recover after PCI; peak troponin I values after PCI were correlating with GLS and moreover deterioration of baseline GLS and its insufficient improvement after PCI are robust indicators of negative LV remodelling at 6 months. The authors concluded that the usefulness and outcome of PCI in the setting of recent NSTEMI was influenced not only by PCI but also by the magnitude of the scarred LV myocardium.
It was discovered that attenuation of GLS at rest in patients of ischemic heart disease was related to the hypoperfusion and reduction of blood supply to the subendocardial region of LV because it is highly susceptible to the impact of ischemia [26, 27]. Rostamzadeh et al [26] demonstrated that in patient suspected to be having coronary artery disease (CAD), unaccompanied by regional wall motion abnormalities at rest were showing impaired LV GLS, GLSR and basal median radial strain rate (MRSR). These features can be effectively utilised to identify high risk patients of CAD. The authors believe that GLS, GLSR and MRSR can be used as a routine examination for diagnosing and risk stratification of CAD cases.
To facilitate superior correlation of optical assessment of regional wall motion kinesis and the magnitude of regional deformation D'Andrea and colleagues [27] expressed that the technique of XStrain 4D STE can be useful for intensified focus on deformation analysis in a single artery supply territory (Figure 9).
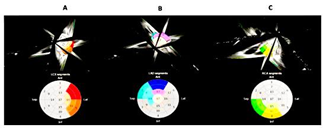
Figure 9: XStrain 4D regional deformation analysis in various coronary artery territories. (A) GLS values in LCX artery perfusion region, (B) LAD artery perfusion region and (C) RCA perfusion region.
- Valvular Heart Disease
XStrain STE can recognise the existence of LV subclinical myocardial dysfunction (Figure 10), and because of adaptive remodelling of LV, these patient may be asymptomatic for a lengthy duration despite the presence of severe valvular disease [28].
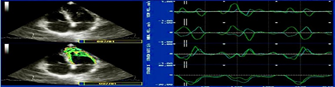
Figure 10: XStrain STE of LV in a patient of tricuspid aortic valve recognising impairment of GLS.
In a study of athletes with bicuspid aortic valve (BAV) and normal LVEF, Stefani et al [29] elucidated that the peak longitudinal systolic strain was lower than the control group. Therefore, the author recommended yearly follow up for comparison of behaviour of LV deformation in these patients.
- Hypertrophic Cardiomyopathy
XStrain STE has been deployed for evaluation of subclinical myocardial damage (Figure 11) in patients of left ventricular hypertrophy and to characterise its various causes [30-33]. Badran et al [33] showed that right atrial (RA) mechanics completely followed right ventricular (RV) and LV function as well as the severity of the disease. There was marked reduction in the entire components of RA functions; the reservoir function, conduit function, and booster pump function with predominant decline in RA reservoir and conduit function in patients of hypertrophic cardiomyopathy (HCM) with preserved LV ejection fraction. Conversely, the contractile function remained unaltered.
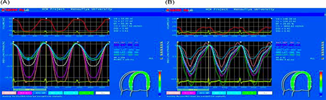
Fig 11: GLS contour in Hypertrophic Cardiomyopathy. (A) In patients with latent obstruction there was lower strain values and increased electromechanical delay, (B) In non obstructive patients there was higher strain values and lower electromechanical delay.
Furthermore, the attenuation of RA conduit function was strongly related to the severity of LV cardiomyopathy and LV deformation.
- Dilated Cardiomyopathy
Few studies of XStrain STE in dilated cardiomyopathy (DCM) patients have substantiated that there was decrement of LV myocardial strain in all the 3 directions (Figure 12).
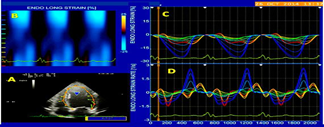
Fig 12: XStrain 4D curves of Strain and Strain rate in patients of dilated cardiomyopathy with LBBB. There was significant of GLS and GLSR in LBBB patients as compared to non LBBB subjects.
The authors commented that STE can be utilized for detection and staging the DCM disease [34, 35]. Badran et al [35] investigated the role of XStrain STE on RV mechanics in patients of DCM and the authors commented that the pathologic mechanism affecting the RV was also causing LV involvement with noteworthy reduction of RV systolic and diastolic functions as well as global and right ventricular free wall function.
- Subclinical Myocardial Deformation in systemic diseases
The unique Xstrain STE technology demonstrated its conspicuous utility in detection of preclinical state in systemic diseases such as Kawasaki disease, Rheumatoid arthritis, Lupus Nephritis, Psoriasis, Systemic Sclerosis, Thalasemia major and Cardiac Amyloidosis (Figure 13-16) [36-42].
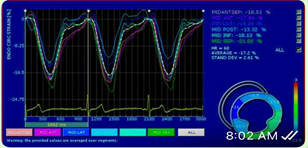
Fig13: XStrain STE in Renal transplant recipients showed significantly impaired GLS than controls (p<0>
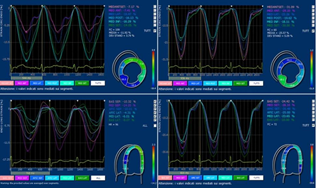
Fig 14: GLS and GCS deformation values were significantly lower in systemic sclerosis patients as compared to healthy subject (p<0>
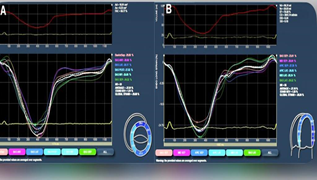
Fig15: 4DXStrain STE in Psoriasis patients. (A) GLS curve in healthy controls and (B) in patients of psoriasis. The GLS was significantly lower in the group of psoriasis on comparing with controls.
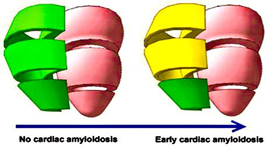
Fig 16: 4DXStrain STE of right ventricular (RV) mechanics in subjects without cardiac amyloidosis (CA) and patients of early stage of CA. It was noted that RV GLS was impaired in mid and basal RV regions in early CA. Normal strain is depicted as green and mild-moderate dysfunction is depicted in yellow.
- Miscellaneous Conditions
- Acute Myocarditis
In a small study of 13 patients [43] of acute myocarditis with absence of regional wall motion abnormalities and preserved ejection fraction of the LV, the authors demonstrated that there was diffuse impairment of GLS (Figure 17) even though the circumferential strain was regionally attenuated. The authors claimed that the results were because of subepicardial damage. Deterioration of GLS and regional circumferential strain along with non-visualisation of regional wall motion abnormality depicts an additional finding supportive of focal myocarditis.
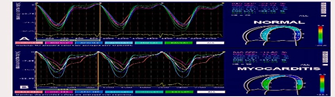
Fig17: (A) normal subject – GLS contour of LV, (B) GLS curve in acute myocarditis.
1.Cardio-toxicity in oncology
It is universally known that before embarking on cancer chemotherapy/radiotherapy it is fundamentally essential to have a knowledge of LV contractility of potential recipient, because such therapies may cause subclinical myocardial damage. Stefani et al [44] commented that GLS is a valuable parameter to authenticate or to exclude the existence of preclinical myocardial dysfunction.
The presence or absence of early LV dysfunction may have far reaching consequences because it may permit or contraindicate rigorous physical activity or sports. This feature is of considerable importance in patients who are totally asymptomatic or with a history of transitory heart failure and where regular and long-term follow up is essential.
2.Cyanotic Congenital Heart Disease
The assessment of LV deformation is crucial in patients of transposition of great arteries (TGA) post arterial switch surgery. In this surgery, coronary arteries may be at risk of injury. Rad et al [45] expressed that GLS, GLSR, global time to peak strain were normal in their 20 postoperative children of age 15 ± 5 months, after a successful arterial switch surgery. Nonetheless, time to peak systolic strain did not normalise in this time period. The authors concluded that some segments of LV myocardium may fully recover and others may not.
3.Wrapping of Left Anterior Descending Artery around Left Ventricular Apex
An Egyptian study [46] of 71 patients of left anterior descending artery (LAD) enveloping the LV apex with a normal coronary angiogram investigated the LV deformation parameters by XStrain STE and the researchers concluded that the notable anatomic feature of LV encasing of LAD provides superior myocardial relaxation with escalated rotational and circumferential mechanics when compared to non wrapping characteristic, in control subjecs (Figure 18).
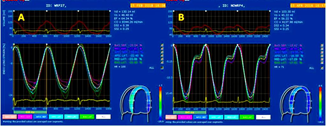
Fig 18: 4DXStrain STE portrayal of LV deformation in a patient of left anterior descending artery enveloping the LV apex with normal coronary angiography.
4.Newer Applications - Vortex Analysis in Heart Failure
LV vortex is a flow structure with a circular or swirling motion that preserves the momentum of late transmitral flow into LV outflow tract during the transition from diastole to systole. A pathophysiological link between diastolic filling and systolic ejection can be identified with LV vortex flow [47].
LV vortex is an important predictor of adverse outcomes in patients of heart failure [47]. The HyperDoppler technique furnishes newer methodology to analyse LV vortex formation (Figures 19, 20), and it investigates the LV contractile function in a different manner [47]. During the Isovolumic contraction phase of the cardiac cycle the LV vortex flow modifies, and the blood flow is diverted to the LV out flow tract, with formation of anterior vortex considerable magnitude of across the LV inflow-outflow region. Later on blood is ejected after the opening of the aortic valve.
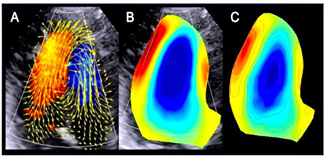
Fig 19: HyperDoppler software was utilized for estimating intracardiac flow dynamics in dilated cardiomyopathy patient. (A) Analysis of vector flow map demonstrates circulation along the posterior lateral wall towards the LV apex, (B) A considerable size rotating Vortex (blue color) is visualized, (C) color map of smooth running flow vortex.
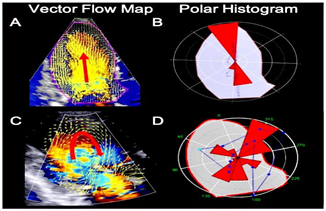
Fig 20: HyperDoppler software employment for analysis of intracardiac flow in healthy subject, (A) and (B) and dilated cardiomyopathy patient (C) and (D). There is a scattered distribution of LV haemodynamic forces in patient of cardiomyopathy.
Advantages
The pioneering and superior technology of 4DXstrain STE has multiple advantages over the freely available 2Dimensionsal STE and is a step forward in the delineation of LV deformation mechanics. Various favourable features are: a) This remarkable tool has a superior spatial and temporal resolution [6]. This translates into resolving the crucial disadvantages related to use of full-volume 3D STE. These constraints are linked to random noise in the image quality, reduced volume rate with correspondent reduction in temporal resolution, decreased voxel size leading to depression of spatial resolution, and suboptimal myocardial tracking [6]. b) The supremacy of XStrain 4D software is because of simultaneous off-line derivation and estimation of the numerous strain components, volumetric indices, cardiac output, EF% and sphericity index [6, 17]. c) This intuitive software provides an augmented and inventive solution to calculate and collate the various constituents of cardiac function in a 3D domain [17, 18]. d) It is relatively inexpensive in comparison to the highly priced 3D/4D STE software [17, 18]. e) There is extremely low interobserver and intraobserver variability [6, 17, 18]. f) Acquisition is considerably smooth and relatively speedier along with expeditious off-line analysis [17, 18].
Limitations
Despite being around for more than a decade, 4DXStrain STE continues to be a research tool and because of certain limitations, its widespread clinical use has been restricted. The limitations are outlined:
- Lack of multicentric RCTs in normal healthy children, adolescent and adult population for obtaining normal reference range values of different parameter of strain and rotation.
- Dependancy on acoustically favourable window for obtainment of excellent resolution of cardiac anatomy.
- Patients with irregular rhythms are excluded from the study because the 4D XStrain STE warrants acquisition of multiple beats in normal sinus rhythm.
- Operator experience and training is an important factor in accuracy of measurements. Since this technology is relatively new, thus only few qualified and trained operators are currently available to conduct the study in a proficient manner.
- It has not yet been validated against cardiac MRI, which is considered to be the gold standard of speckle tracking echocardiography.
Future research directions
With newer techniques of “e Doppler” (for automatic correction of doppler angle, box position, sample volume position and steering, for a fast and optimised calculation) and "Elaxto" (an echocardiographic revolution for determination of tissue elasticity) on the horizon, it is of paramount importance that for accurate interpretation of 4DXStrain STE, relentless medical education and training are essential both for the scientific research and clinical domain. The dedicated XStrainTM software requires adequate qualifications and operator expertise to obtain exquisite images and accurately estimate the projected values of myocardial strain and rotation parameters. According to us the future directions suggested are:
1.Large scale randomised controlled trials (RCTs) should be conducted to define the cut-off normal value ranges of various strain parameters in a healthy population. This will facilitate in distinguishing between the diseased and normal healthy population.
2.Furthermore, a correlation relationship of strain parameters amongst themselves and with LV hemodynamic variables as well as demographic characteristics in healthy population, should be planned and executed in these research trials.
3.Clinical trials to study the incremental prognostic value of 4DXStrains STE for forecasting morbidity, mortality and arrhythmic events in comparison with LV ejection fraction and GLS are warranted in future.
4.A widespread educational initiatives for increasing the awareness of 4DXstrain STE and moreover, for a consistent application of the technology for a variety of clinical settings.
5.An intensified effort should be obligated for a dignified inter-vendor relationship regarding sharing of proprietary software to decrease the inter-vendor variableness and disparities.
6.Clinical studies should be undertaken to validate the technique against cardiac MRI, which is the current gold standard for deformation analysis.
7.Further clinical studies are warranted to assess the reversibility of myocardial ischemia and a corresponding reduction in impairment of myocardial deformation. This will lead to a better understanding of the magnitude of reversibility of strain with medical therapy/coronary angioplasty.
Conclusion
XStrain 4D is a non-invasive advanced echocardiographic tool to investigate myocardial deformation and rotational mechanics in a superior and exceptional manner. None other currently available 2D STE/ 3D STE commercially available systems are in possession of the ability to estimate a multitude of parameters which the XStrain 4D boasts off. It is relatively inexpensive as compared to highly priced 3D STE systems. Nonetheless, augmented clinical research studies are necessary to maximize its clinical use and to clearly demarcate its advantage in comparison with the well-established methods.
Acknowledgement
We humbly acknowledge the incredible efforts of Faiz Illahi Siddiqui, for his immense sincerity in typing the manuscript repeatedly due to multiple revisions suggested by the respected reviewers.
His instinctive and intuitive aptitude is exemplified in the creation of the diagrammatic illustration of LV border mapping (Figure 3A).
Conflicts of Interest
The authors declare no conflict of interest.
Funding
This research received no external funding.
References
-
Yingchoncharoen T, Agarwal S, Popovic ZB. Normal ranges of left ventricular strain: a meta-analysis. J Am Soc Echocardiogr. 2013; 26:185-91.
Publisher | Google Scholor -
Lang RM, Badano LP, Mor-Avi V, Afilalo J, Armstrong A, Ernande L, Flachskampf FA, Foster E, Goldstein SA, Kuznetsova T, Lancellotti P, Muraru D, Picard MH, Rietzschel ER, Rudski L, Spencer KT, Tsang W, Voigt JU. Recommendations for cardiac chamber quantification by echocardiography in adults: an update from the American Society of Echocardiography and the European Association of Cardiovascular Imaging. J Am Soc Echocardiogr. 2015; 28:1-39.
Publisher | Google Scholor -
.Jasaityte R, Heyde B, D'Hooge J. Current state of three-dimensional myocardial strain estimation using echocardiography. J Am Soc Echocardiogr.2012; 26:15-28.
Publisher | Google Scholor -
Papademetris X, Sinusas AJ, Dione DP, Duncan JS. Estimation of 3D left ventricular deformation from echocardiography. Med Image Anal. 2001; 5: 17-28.
Publisher | Google Scholor -
Elen A, Choi HF, Loeckx D. Three-dimensional cardiac strain estimation using spatio-temporal elastic registration of ultrasound images: a feasibility study. IEEE Trans Med Imaging 2008; 27:1580-91.
Publisher | Google Scholor -
Muraru D, Niero A, Zanella HR, Cherata D, Badano LP. Three-dimensional speckle-tracking Echocardiography: Benefits and limitations of integrating myocardial mechanics with three-dimensional imaging. Cardiovasc. Diagn. Ther, 2018; 8: 101- 117.
Publisher | Google Scholor -
Van mil AC, Pearson J, Drane AL, Cockcroft JR. McDonnell B and Stoehr EJ. Interaction of LV Twist with arterial haemodynamics during localised. Exp Physiol. 2016; 101:509-520.
Publisher | Google Scholor -
Stöhr EJ, Shave RE, Baggish AL, Weiner RB. Left ventricular twist mechanics in the context of normal physiology and cardiovascular disease: a review of studies using speckle tracking echocardiography. Am J Physiol Heart Circ Physiol. 2016; 311:H177-H182.
Publisher | Google Scholor -
Carreras F, Garcia-Barnes J, Gil D, Pujadas S, Li CH, Suarez-Arias R. Leta R, Alomar X, Ballester M, Pons-Llado G. Left ventricular torsion and longitudinal shortening: two fundament components of myocardial mechanics assessed by tagged cine-MRI normal subjects. Int J Cardiovasc Imaging. 2012; 28: 273-84.
Publisher | Google Scholor -
Takahashi K, Naami GA. Thompson R, Inage A, Mackie AS, Smallhorn JF, Normal rotational, torsion and untwisting data in children, adoledcents and young adults. J Am Soc Echocardiogr.2010; 23:286-93.
Publisher | Google Scholor -
Reckefuss N, Butz T, Horstkotte D and Faber L. Evaluation of longitudinal and radial left ventricular function by two-dimensional speckle-tracking echo-cardiography in a large cohort of normal probands. Int J Cardiovasc Imaging. 2011; 27:515-526.
Publisher | Google Scholor -
Muraru D, Cucchini U, Mihăilă S, Miglioranza MH, Aruta P, Cavalli G, Cecchetto A, Padayattil-Josè S, Peluso D, Iliceto S, Badano LP. Left ventricular myocardial strain by three-dimensional speckle-tracking echocardiography in healthy subjects: reference values and analysis of their physiologic and technical determinants. J Am Soc Echocardiogr. 2014; 27:858-871.
Publisher | Google Scholor -
EXPERT CONSENSUS STATEMENT: Current and Evolving Echocardiographic Techniques for the Quantitative Evaluation of Cardiac Mechanics: ASE/EAE Consensus Statement on Methodology and Indications. Endorsed by the Japanese Society of Echocardiography. Mor-Avi V, J Am Soc Echocardiogr. 2011; 24:277-313.
Publisher | Google Scholor -
Corda A, Parpaglia MLP, Sotgiu G, Zobba R, Onchoa PG, Ramos JP, French A, use of 2-dimensional speckle-tracking echocardiography to assess left ventricular systolic function in dogs with systemic inflammatory response syndrome. J Vet Intern Med 2019; 33:423-43.
Publisher | Google Scholor -
Di Bella G, Pedri S, Schreckenberg M, et al. Three and four dimensional quantification of left ventricular volumes and ejection fraction on the basis of feature strain echocardiography. (2011) 72 Congresso Nazio- nale della Società Italiana di Cardiologia. G Ital Cardiol. 2011; 106:12.
--> -
Dragulescu A, Grosse-Wortmann L, Fackoury C, Mertens L. Echocardiographic assessment of right ventricular volumes: a comparison of different techniques in children after surgical repair of tetralogy of Fallot. Eur Heart J Cardiovasc Imaging. 2012; 13:596-604.
Publisher | Google Scholor -
Mehrotra A, Kacker S, Shadab M, Chandra N, Singh AK. 4 Dimensional XStrain speckle tracking echocardiography: comprehensive evaluation of left ventricular strain and twist parameters in healthy Indian adults during COVID-19 pandemic. Am J Cardiovasc Dis. 2022; 12:192-204.
Publisher | Google Scholor -
Mehrotra A, Sharma A, Shadab M, Srivastava M,Chandra N, Singh A. Dimensional X Strain and 2Dimensional Speckle Tracking Echocardiographic Study: Normative Values of Strain Parameters of Left Ventricle and Tissue Doppler Imaging of Ascending Aorta in Healthy Adults -A Single Centre Indian Study. Texila International Journal of Academic Research. 2022; 9:120-141.
Publisher | Google Scholor -
Mehrotra A, Kacker S, Shadab M, Chandra N, Singh AK, Sharma A. 4Dimensional X-Strain Speckle Tracking Echocardiography: Assessment of Normal Values of Left Ventricular Rotation and Twist, in Healthy Indian Adults during the Covid-19 Pandemic. Texila International Journal of Public Health. 2022; 10:382-397.
Publisher | Google Scholor -
Mehrotra A, Kacker S, Shadab M, Prakash O, Singh AK, Sharma A, Four-Dimensional XStrain Echocardiography: Correlation of Aortic Stiffness with Left Ventricular Diastolic, Systolic, and Strain Parameters in Healthy Adults - A Single-center Indian Perspective. Journal of Indian College of Cardiology. 2023; 13:29-39.
Publisher | Google Scholor -
Oleynikov VE, Galimskaya VA, Kupriyanova SN, Burko NV. Use of the Speckle tracking method for determining global parameters of heart contractility in healthy individuals. Method X, 2018; 5:125-135.
Publisher | Google Scholor -
Mehrotra A, Kacker S, Patnaik A. 4Dimensional XStrain Echocardiography: M-mode and Tissue Doppler Estimation of Age and Gender Specific Normative Values of Aortic Stiffness in Healthy Adults during Covid -19 Pandemic. Clinical Cardiovascular Research. 2023; 2: 1-17.
Publisher | Google Scholor -
D’Andrea A, Mele D, Agricola E, Pezzullo E, Cameli M, Rossi A, Esposito R, Novo G, Mondillo s, Montisci R, Gallina S, Bossone E, Galderisi M. XStrain 4D analysis predicts left ventricular remodeling in patients with recent non -ST-segment elevation myocardial infarction. International Journal of Cardiology 2016; 2016:107-109.
Publisher | Google Scholor -
Eek C, Grenne B, Brunvand H, Aakhus S, Endresen K, Smiseth OA, Edvardsen T, Skulstad H. Strain echocardiography predicts acute coronary occlusion in patients with non-ST-segment elevation acute coronary syndrome. Eur J Echocardiogr. 2010; 11:501-50 8.
Publisher | Google Scholor -
D'Andrea A Cocchia R, Caso P, Riegler L, Scarafile R, Salerno G, Golia E, Di Salvo G Calabrò P, Bigazzi MC, Liccardo B, Esposito N, Cuomo S, Bossone E, Russo MG ID Calabrò R Global longitudinal speckle- tracking strain Is predictive of left ventricular remodeling after coronary angioplasty in patients with recent non - ST elevation myocardial infarction. International Journal of Cardiology, 2010; 153:185-191.
Publisher | Google Scholor -
Rostamzadeh A, Shojaeifard M, Rezaei Y, Dehghan K. Diagnostic accuracy of myocardial deformation indices for detecting high risk coronary artery disease in patients without regional wall motion abnormality. Int J Clin Exp Med. 2015; 8:9412-9420.
Publisher | Google Scholor -
D'Andrea A, Sperlongano S, Pacileo M, Venturini E, lannuzzo G, Gentile M, Sperlongano R, Vitale G, Maglione M, Cice G, Maria Sarullo F, Di Lorenzo A, 2020 Vigorito C, Giallauria F. New Ultrasound Technologies for Ischemic Heart Disease Assessment and Monitoring in Cardiac Rehabilitation. Picano E J Clin Med, 2020; 9:E3131.
Publisher | Google Scholor -
Hussein Awad Hemeda, Mahmoud Shawky Abd Elmoneum, Eman Said Al Kishk, Sayed Abd El Khaleq El Darky. Echocardiographic assessment of the left atrial function in patients with mitral valve disease by two- dimensional speckle tracking. Cardiovascular System. 2018; 6:1.
--> -
Stefani L, Luca AD, Maffulli N, Mercuri R, Innocenti G, Sultiman I, Tonceli L, Vono MC, Cappelli B, Pedri S, Perizzetti G and Galanti G. Speckle tracking for left ventricle performance in young athletes with bicuspid aortic valve and mild aortic regurgitation. European Journal of Echocardiography. 2009; 10:527-531.
Publisher | Google Scholor -
Badran HM, Elnoamany MF, Soltan G, Ezat M, Elsedi M, Abdelfatah RA, Yacoub M. Relationship of mechanical dyssynchrony to QT interval prolongation in hypertrophic cardiomyopathy. European Heart Journal - Cardiovascular Imaging. 2012; 13:423-432.
Publisher | Google Scholor -
Badran HM, Ibrahim WA, Faheem N, Yassin R, Alashkar T, Yacoub M. Provocation of left ventricular outflow tract obstruction using nitrate inhalation in hypertrophic cardiomyopathy: Relation to electromechanical delay. Glob Cardiol Sci Pract. 2015;2015:15.
Publisher | Google Scholor -
Badran HM, Ahmed NF, Ibrahim WA, Khalifa MM. Assessment of right ventricular response to exercise using vector velocity imaging in hypertrophic cardiomyopathy. Menoufia Med J 2014; 27:136-144.
Publisher | Google Scholor -
Badran HM, Sultan GM, Ahmed NF, Mohamed HA. Assessment of right atrium function in hypertrophic cardiomyopathy by speckle-tracking echocardiography. Menoufia Medical Journal. 2017; 30:823-831.
Publisher | Google Scholor -
Emara A, Badran HM, Abdou W, Fahim N, Fathi M and Yacoub MH. Impact of Left Bundle Branch Block on Left Ventricular Mechanics in Patients with Idiopathin Dilated Cardiomyopathy. World Journal of Cardiovascular Diseases, 2019; 4:132-148.
Publisher | Google Scholor -
Badran HM, Ahmed NF, Mahdy EE, Right ventricular mechanics in patients idiopathic dilated cardiomyopathy using strain imaging, Menoufia Med J 2018; 31: 395-401.
Publisher | Google Scholor -
Hematian MN, Torabi S, Malkan-Rad E, Zanjani K, Ziaee V, Lotfi-Tolkaldany M: Noninvasive evaluation of Myocardial Systolic Dysfunction in the early stage of Kawasaki Disease: A Speckle-Tracking Echocardiography study. Iran J Pediatr. 2015; 25:198.
Publisher | Google Scholor -
Benacka O, Benacka J, Blazicek P, Belansky M, Payer J, Killinger Z and Lietava J:A Speckle-tracking Echocardiography is More Sensitive in Detecting Subclinical Myocardial Dysfunction in Patients with Rheumatoid Arthritis. Journal of Arthritis. 2016; 5:224
--> -
Atteritano M, Visconti L, Dattilo G, Zuppardo C, Lacquaniti A, Parato VM, Migliorato A, Conti' G and Santoro D. Non-Invasive Imaging for Evaluating Cardiovascular Involvement in Patients with Primary and Lupus Nephritis. The Open Rheumatology Journal. 2019; 13:86-93.
Publisher | Google Scholor -
Dattilo G, Imbalzano E, Casale M, et al. Psoriasis and Cardiovascular Risk: Correlation between Psoriasis and Cardiovascular Functional Indices. Angiology. 2018; 69:31-37.
Publisher | Google Scholor -
Piccione M, Zito C, Bagnaton G, Oreto G, Bella G, Bagnato G and Carerj S. Role of 2D strain in the early identification of left ventricular dysfunction and in the risk stratification of systemic sclerosis patients. Cardiovascular Ultrasound. 2013; 11:6.
Publisher | Google Scholor -
Shahryari M, Mehdizadegan N, Amoozgar H, Borzouee M, Ajami G, Cheriki S, Edraki M, Shakiba A, Mohammadi H and Keshavarz K; Efficacy of High Dose and Short Course of Deferoxamine Infusion on Cardiac Remodeling of Children with Thalassemia Major. Iran J Pediatr. 2013; 23:79684.
Publisher | Google Scholor -
Bella GD, Minutoli F, Piaggi P, Casale M, Mazzeo A, Zito C, Oreto G, Baldari S, Vita G, Pingitore A, Khandheria BK, Carerj S. Quantitative Comparison Between Amyloid Deposition Detected by 99mTc- Diphosphonate Imaging and Myocardial Deformation Evaluated by Strain Echocardiography in Transthyretin-Related Cardiac Amyloidosis. Cric J 2016; 80:1998-2003
Publisher | Google Scholor -
Bella GD, Gaeta M, Pingtore A, Oreto G, Zito C, Minutoli F, Anfuso c, Dattilo G, Lamari A, Coglitore S, Carerj S. Myocardial Deformation in Acute Myocarditis With Normal Left Ventricular Wall Motion - A Cardiac Magnetic Resonance and 2-Dimensional Strain Echocardiogrphic Study. Circ J 2010; 74:1205-1213.
Publisher | Google Scholor -
Stefani L, Pedrizzetti G and Galanti G. Clinical Application of 2D Speckle Tracking Strain for Assessing Cardio-Toxicity in Oncology. J. Funct. Morphol. Kinesiol. 2016; 1:343-354.
Publisher | Google Scholor -
Rad E, Ghandi Y, Kocharian A, Mirzaaghayan M. Left Ventricular Function after Arterial Switch Operation as Assessed by Two-Dimensional Speckle-Tracking Echocardiography in Patients with Simple Transposition of the Great Arteries. The Journal of Tehran Heart Center 2016; 11:105-110.
Publisher | Google Scholor -
Badran HM, Ibrahim WA, Alaksher T and Soltan G. Impact of the left anterior descending artery wrapping around the left ventricular apex on cardiac mechanics in patients with normal coronary angiography. The Egyptian Heart Journal. 2020; 72:33.
Publisher | Google Scholor -
Sperlongano S, D'Andrea A, Mele D, et al. Left Ventricular Deformation and Vortex Analysis in Heart Failure: From Ultrasound Technique to Current Clinical Application. Diagnostics (Basel). 2021; 11:892.
Publisher | Google Scholor